 Es
EsTrade Sabre Rattling Likely Drew in More Steel, Autos in June
U.S. import growth probably continued in June, with seaborne shipments rising 3% on a year earlier, Panjiva data shows. That was the fourth straight month of growth, and may be understated if the Petya virus delayed reporting from Maersk. Shipments from the EU led the way in absolute terms with 13% growth, while Vietnam was the fastest growing major market at 14%. The latter may be targeted by the forthcoming Omnibus report on the causes of the trade deficit. Uncertainty about, but expectations of, tariffs and quotas later in the summer likely drove a 9% rise in automotive imports and 27% jump in steel industry shipments. Based on performance so far, full year 2017 imports by sea may rise 3% on a year earlier, with slowing consumer sentiment being offset by still-bullish business expectations.
U.S. import growth continued in June, with Panjiva data showing reported seaborne shipments increased 2.8% on a year earlier. That was the fourth straight month of growth, though it was the slowest rate of expansion – excluding February’s holiday-driven decline – since September. The figures may be understated due to Maersk’s disruptions from the Petya computer virus at month end, as outlined in Panjiva research of June 28. The final reported figure may therefore be higher.

Source: Panjiva
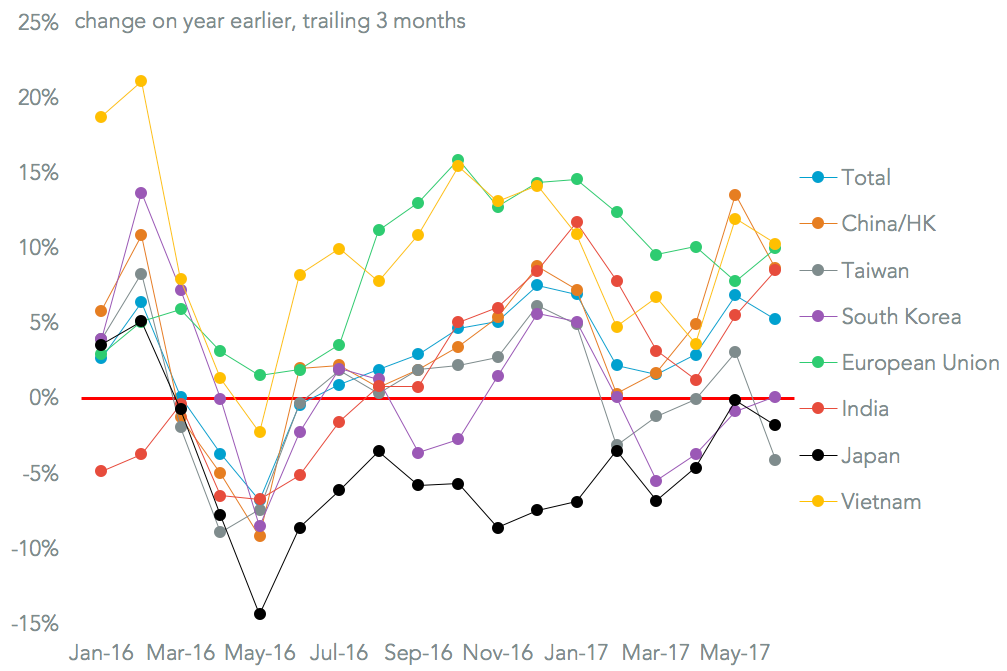
The most significant contribution to growth came from suppliers in the European Union, which climbed 12.8% on a year earlier. That was a return to significant growth after a drop to a rate of just 1.4% a month prior. Imports from China and Hong Kong expanded 4.1% on a year earlier, while Taiwan and South Korea both saw a slowdown. Among the emerging markets Vietnam’s growth was fastest at 14.4%, accelerating the quarterly expansion to 10.3% from 6.7% in the first. The country may be a target for the Omnibus review of the causes of the trade deficit.
Source: Panjiva
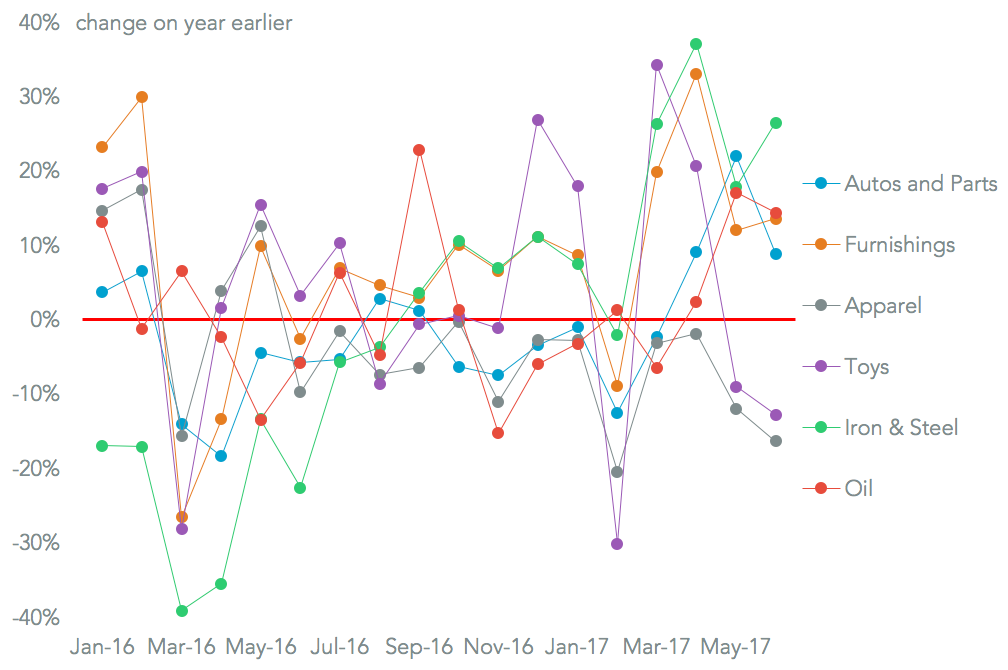
Among key product lines the two “tariff sensitive” sectors of autos and steel both saw significant growth. In some regards the delays and uncertainty associated with policy moves may be generating a self-defeating spike in imports. Automotive industry imports – both parts and completed vehicles – increased 8.9%. That was the third straight month and brought the third quarter growth to 13.1%. With slowing U.S. sales there is a clear risk of significant inventory build.
Imports of major steel products increased 26.5% in June, bringing the second quarter expansion to 27.0% after 9.2% growth in the first quarter. It appears clear that suppliers are building up stocks ahead of the Commerce Department’s section 232 review of the industry and risk of subsequent tariffs or quotas.
Source: Panjiva
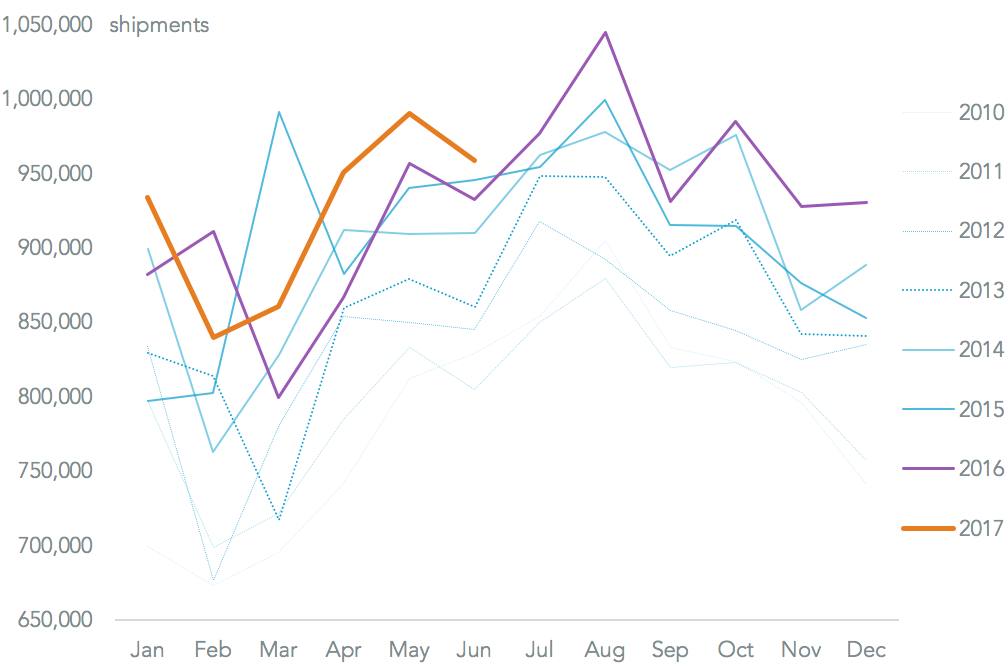
Over the past six years 48.2% of full year shipments have been completed by the end of June – the back-end loading partly reflects the holiday gift-giving season, shipments for which start in August and September. On that basis full year 2017 shipments could increase 3.0% on a year earlier to 11.47 million.
One risk to this is that consumer sentiment is beginning to slow, as shown by the University of Michigan consumer sentiment survey which has dipped to pre-election lows. That has yet to be seen in retailers’ expectations – furniture imports increased 13.6% in June. As a counterpoint business managers’ views are at their most positive since August 2015. Absent any broad-based, short-term protectionist measures from the government import growth should continue.
Source: Panjiva