 Es
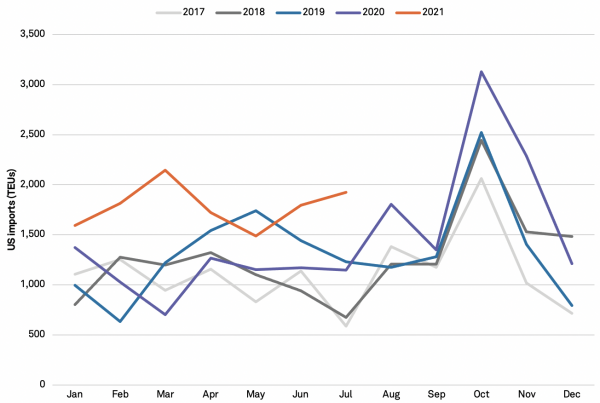
EsBJ’s Wholesale club reported FQ2 earnings covering the three months to July 31. The company announced revenues that increased by 5.6% year over year and exceeded analyst expectations by 10.0%. Panjiva data associated with the firm shows it maintained high imports throughout the first half of the 2021 and saw volumes in its FQ2 increase 50.2% year over year. This stays positive when compared to 2019, up 18.0% against unusually high imports that were likely tied to tariff concerns. Around 81.7% of imports in 2019 came from China.
This has continued, with 80.7% of goods imported in the first 7 months of 2021 coming from China, and this likely exposes the firm to the congestion discussed in Panjiva’s research of Aug. 12. Statements by CEO Robert Eddy during the Aug. 19 earnings call reinforce this notion. Mr. Eddy said they “expect supply chain and sourcing challenges to continue for the foreseeable future.”
The CEO also outlined their plans against inflation saying that they had a “toolkit” including “negotiating with our suppliers, changing pack sizes, cutting items [and] buying in inventory” as well as saying they will be “as aggressive as we can with our suppliers.”
Source: Panjiva
Seaborne import data shows BJ’s Wholesale’s increased imports have mostly come from homewares. These goods are durable and non-perishable, making them good candidates for sourcing internationally through maritime shipping. Breaking this down further, imports of linens, kitchenware, and furniture saw increases of 52.4%, 46.5% and 45.8% year over year respectively, likely as consumers refreshed homes and business for gatherings. Imports of luggage and toys also increased by 35.6% and 18.1% year over year respectively, likely reflecting increased demand for those items. The only large category that saw stagnant growth was appliances, increasing by just 1.4% year over year. This category was also down 17.9% against the same period in 2019, possibly due to supply constraints and tariffs, as mentioned in Panjiva’s research of Aug. 24.

Source: Panjiva


