 Es
EsThe phase 1 trade deal between the U.S. and China included significant commitments from the Chinese government in terms of purchasing of U.S. goods and services including farm products, energy and manufactured goods. As discussed in Panjiva’s research of Feb. 26 there is the potential for the targets to be missed as a consequence of economic disruptions caused by the COVID-19 coronavirus outbreak.
From a headline perspective the commitments call for U.S. exports of goods to China to be increased by $63.9 billion in 2020 versus 2017. That’s equivalent to a 59.9% year over year increase in total exports – including goods outside the phase 1 commitments – for calendar 2020 versus 2019.
In January the increase was 1.0%, Panjiva’s analysis of official data shows. Indeed, that underperformed the growth in exports to all other countries which reached 3.1%.

Source: Panjiva
In the energy sector the U.S. Energy Secretary, Dan Brouillette, has stated that “I don’t think there’s any expectation that anyone’s not going to honor the agreements that they struck in Phase 1, so we have every expectation that they will.“, S&P Global Platts reports.
In January that certainly wasn’t the case.
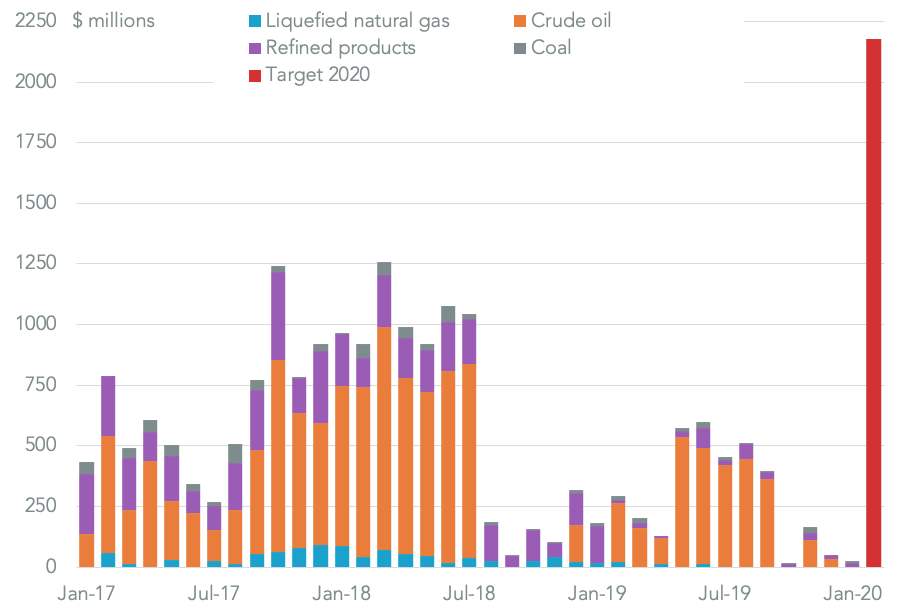
U.S. exports of energy products, including LNG, crude oil, refined products and coal, were worth just $26 million, Panjiva’s data shows. Within that category, shipments of LNG and crude oil were zero. In January 2019 the figure was $181 million and in January 2017 it was $433 million. The run-rate for the phase 1 commitment is equivalent to $2.18 billion per month.
The collapse in oil prices caused by the Saudi Arabia-Russia trade war, which led to an initial 30% drop in prices on March 8 according to S&P Global Market Intelligence, will make that target even harder to achieve.
Source: Panjiva
Of the three sectors where commitments have been made, only agriculture has shown a year over year increase, with a 67.4% increase driven by a 615.1% surge in soybean shipments. Yet, the sector’s exports of $1.39 billion were still 42.9% lower than 2018 and compare to a 2020 run-rate target for China’s purchasing commitments of $2.78 billion.
Similarly the manufactured goods sector saw a 0.3% year over year decline in exports despite a 5.4% rise in shipments of industrial machinery and a 17.3% increase in iron and steel exports.
Notably there was a 45.3% drop in pharmaceutical shipments – that may not increase if the U.S. follows the lead of other countries in restricting exports of healthcare products. When compared to 2017 there were $3.45 billion of exports compared to the $6.97 billion required run rate.
Taken in aggregate then, total exports of goods where China has made a purchasing commitment reached $4.86 billion in January. While that was 8.8% higher than a year earlier it was still 23.3% lower than 2017 and compares to a $11.93 billion commitment implied by the phase 1 deal.

Source: Panjiva


