 Es
EsPresident Trump’s Council of Economic Advisors has issued a paper making policy suggestions on how to reduce healthcare costs. These break into two parts namely: reducing the cost of drug purchasing in the U.S. by reforming the FDA approvals process as well as purchasing models; and by cutting so-called “free riding” on innovation where drugs are cheaper overseas than in the U.S.
The latter may be addressed via “through enhanced trade policy or policies that tie public reimbursements in the United States to prices paid by foreign governments”, though details on how trade policy would tie into this aren’t clear. Traditional trade policy works on the basis of dumping of goods below cost into a market, rather than it being sold in another market at a lower price.
The average import cost of drugs into the U.S. has been in steady decline already. Panjiva data shows that taken as an average across all drug classes spending fell by 2.3% in 2017 vs. 2016 despite a 15.3% rise in December. That included a 20.9% drop in average import costs per gram (17.5% in December) that would suggest either a change in mix of imports or genuinely lower costs that may (or may not) be being passed onto patients.

Source: Panjiva
There has been a significant dispersion in changing costs across classes, however. Imports of oncology / immunology treatments for example saw an average 4.6% rise in average cost per gram in 2017 vs. 2016 and anticonvulsants an 8.5% rise. On the other hand more widely prescribed treatments including those for cardiovascular (down 30.5%) and gastrointestinal conditions (down 16.6%) saw marked declines.
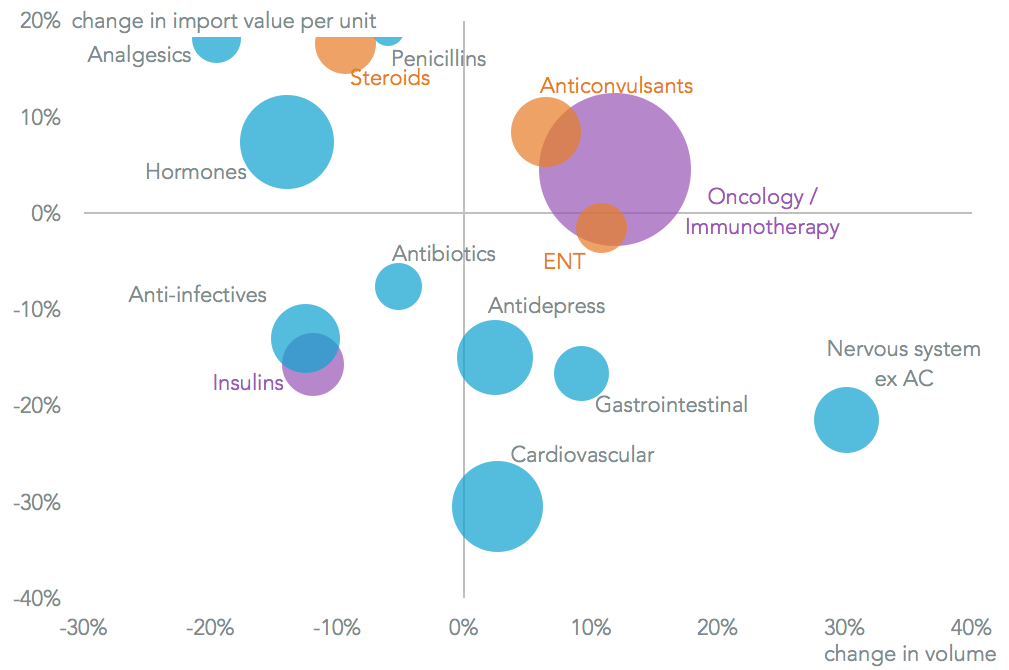
Source: Panjiva


