 Es
EsThe outlook for global trade in the second half of the year was the main focus of our readers’ interest in July. The impact of the COVID-19 pandemic hit home for the retail sector in July with signs of recovery coming too late for retailers declaring bankruptcy protection including Ascena Retail, Brooks Brothers & Muji.
Broader export sentiment among businesses in the U.S. and China improved but remained negative while the logistics sector is facing technical challenges in keeping the right equipment in the right place at the right time. One sector that has done well throughout the pandemic has been solar power equipment makers.
The regulation of international trade has remained important throughout the pandemic too. The U.S. Customs & Border Protection authority detained shipments of medical supplies linked to Top Glove on the basis of accusations of the use of forced labor in Malaysia. Sanctions were also applied against 11 Chinese companies in relation to repression of the Uigher population – we identified companies whose supply chains may be exposed.
U.S. trade policy more broadly has continued to evolve in the face of a dip in medical supply imports and statements from both the administration of President Trump and the campaign of former Vice President Biden ahead of the elections. Finally, the state of the U.S.-China trade deal remained a focus as the Chinese government started to apply restrictions to shipments of farm goods.
#1 COVID-22 and trade war 2.0, the outlook for Q3 and beyond (July 17)
Panjiva Research held a webinar on July 15 to discuss our Q3 outlook including views on the prospects for COVID-19, the U.S.-China trade war and corporate strategic reactions to both. This report includes a link to the recording and answers respondents’ questions. We asked participants how long they expect before supply chain activity returns to pre-pandemic levels. Just 6.5% expect that in 2020 with 61.0% expecting it in 2021 and the remainder in 2022.
Among questions asked we noted that food supplies have been secure during COVID-19 though there are concerns going forward about disruptions caused by increased inspections in China. Regarding PPE supply strategies it’s worth noting that there was a surge in shipments of face masks to the U.S. in May and June combined that was equivalent to the prior 80 months of imports, the government still needs to put a cogent strategy in place to prevent future shortages.
Air freight rates remain elevated with capacity utilization levels running at 57.6% in May, and need a return of passenger flights to normalize. In a second poll we asked participants what they expect for U.S.-China relations ahead of the general elections, with 42.5% expecting a worsening of relations without policy changes and 36.8% who expect a worsening and a new set of policies such as tariff increases.
Firms are starting to realign their supply chains, but face increased costs. Moving to North America in response to USMCA may be better for high value-add items, but Mexican exports of labor intensive apparel to the U,.S. have fallen by 6.2% in the 12 months to March 31 versus 2016. In other sectors “in market for market” is getting underway, for example with Ford’s new plans in Mexico. Exporters in Central Europe may struggle to take advantage of worse U.S.-China relations given EU-U.S. relations also remain fraught.
Exporters from Latin America may be helped by a U.S.-Brazil trade deal, though that is unlikely before the end of the year. India has seen a 10.3% increase in exports in 2019 versus 2016, though that has lagged Vietnam and the Philippines which grew by 20.0% and 13.6% as firms preferred the latter two countries as locations for U.S.-bound supplies.

Source: Panjiva
#2 Lenovo, Alstom face supply chain choices after Xinjiang Entity List ruling (July 22)
The U.S. Commerce Department has added 11 companies to its Entity List of firms which face trade sanctions in relation to repression of the Uigher people and other Muslim groups in China’s Xinjiang province. The companies covered supply technology and apparel products to the U.S., with U.S. importers facing the need to change their supply chains even if they are not complicit in the accusations or even aware of them.
Panjiva’s seaborne data shows that Lenovo may have received 50 shipments of computing products from Heifei Bitland in the 12 months to June 30. Transportation equipment supplier KTK Group may have made 43 shipments to Alstom, 19 to GE and 7 to Wabtec during the same period. Among others, Par Technology may have received one shipment from Nanchang O Film.
Other firms had already cut back their imports from Xinjiang based firms over the past two years. Imports linked to the 11 entities fell by 66.9% year over year in Q2 and by 20.3% in 2019 versus 2018, including a reduction in shipments linked to Danby Products and Costco.

Source: Panjiva
#3 Top Glove faces forced labor charges as shipments surge (July 21)
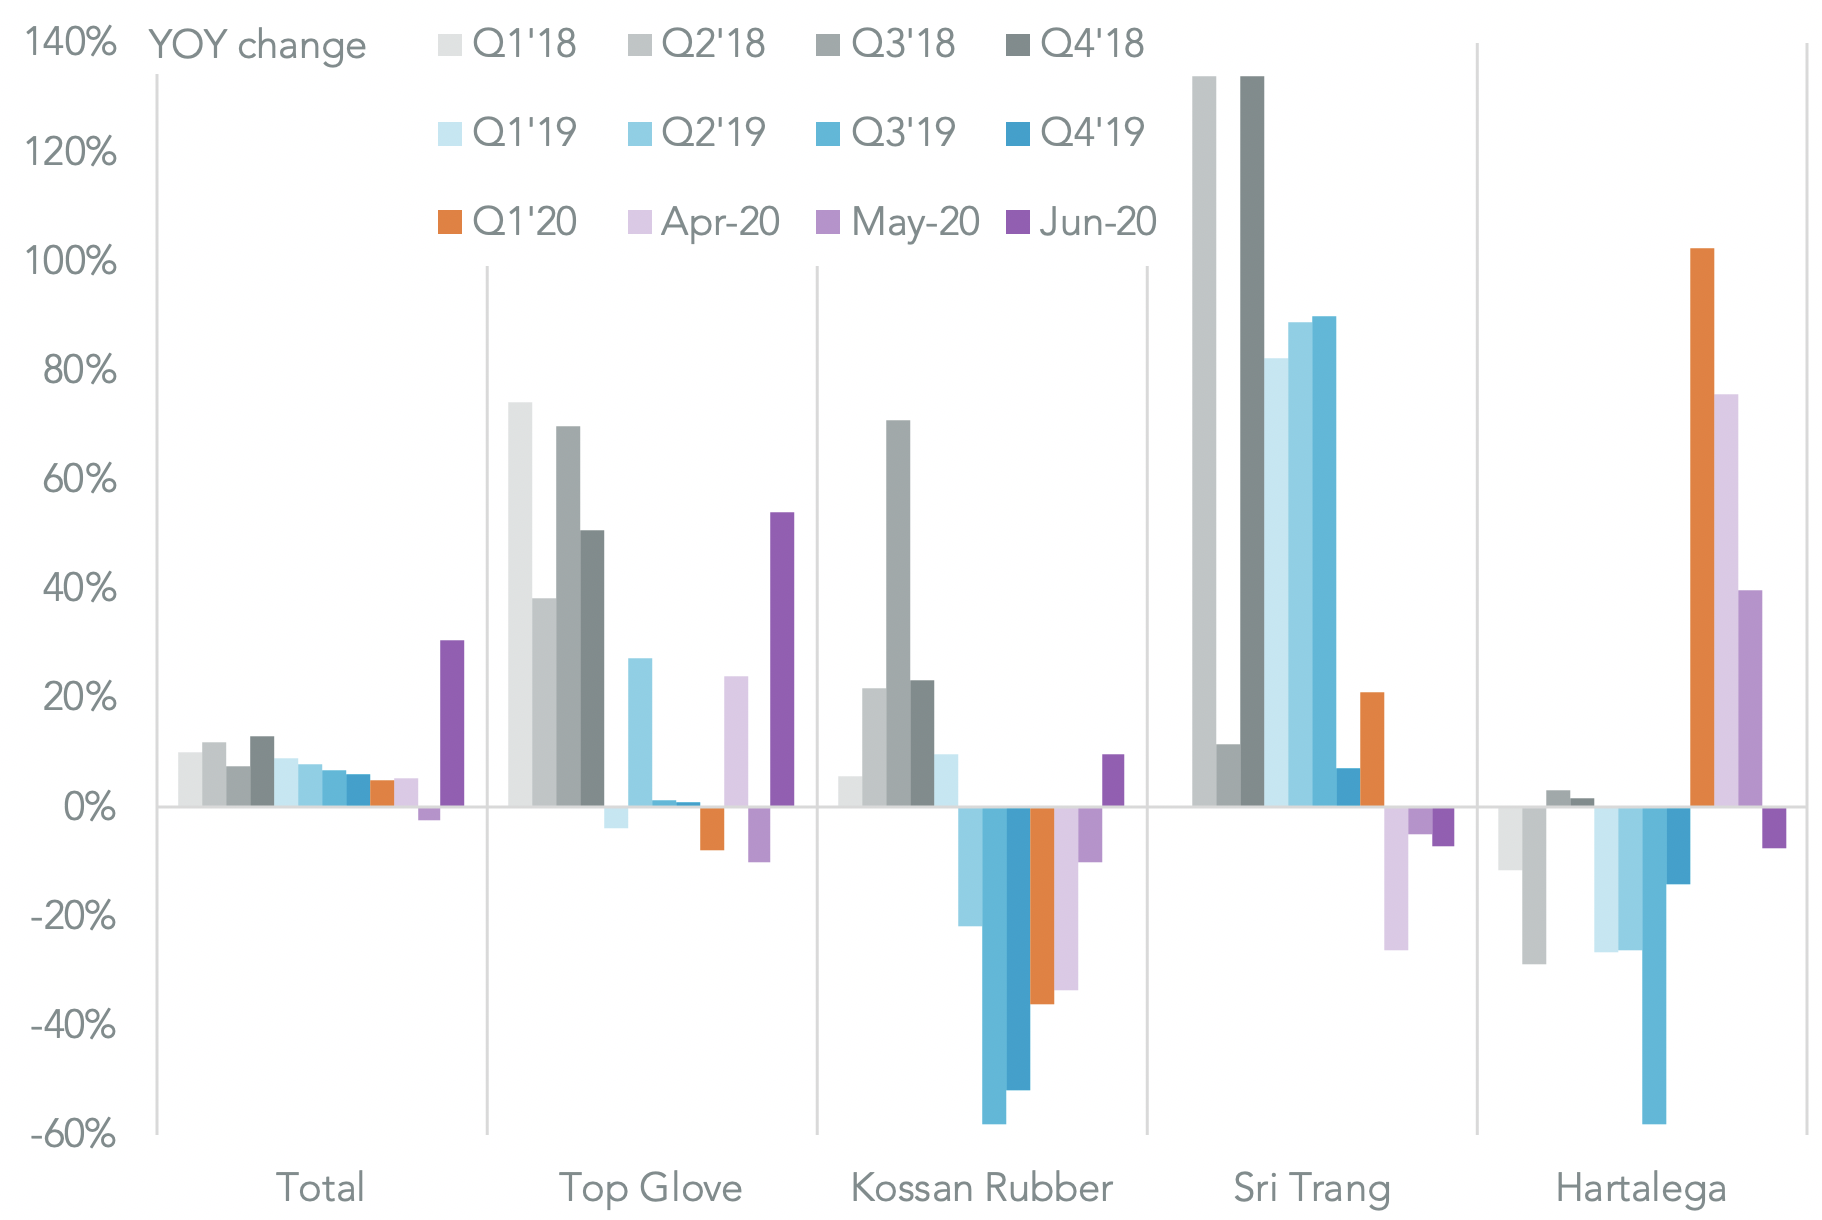
U.S. Customs & Border Protection has issued withhold release orders (WRO) against medical glove imports by Top Glove, citing accusations of forced labor practices. The firm has indicated half its U.S. bound shipments may be affected. Panjiva’s data shows that U.S. seaborne imports linked to the Top Glove have surged inline with COVID-19 related demand with a 54.0% year over year surge in June, led by a 59.2% jump in imports from Malaysia.
U.S. based recipients of shipments linked to Top Glove, but not necessarily of the impounded products, include subsidiaries of Genuine Parts, Volk Enterprises and Tranzonic among others. Total U.S. imports of rubber gloves rose 30.7% year over year in June. Shipments linked to Kossan Rubber also improved by 9.7% while those associated with Sri Trang and Hartalega fell by around 7.2% and 7.5% respectively.
Source: Panjiva
#4 Solar surge follows decade of tariff, support uncertainty (July 20)
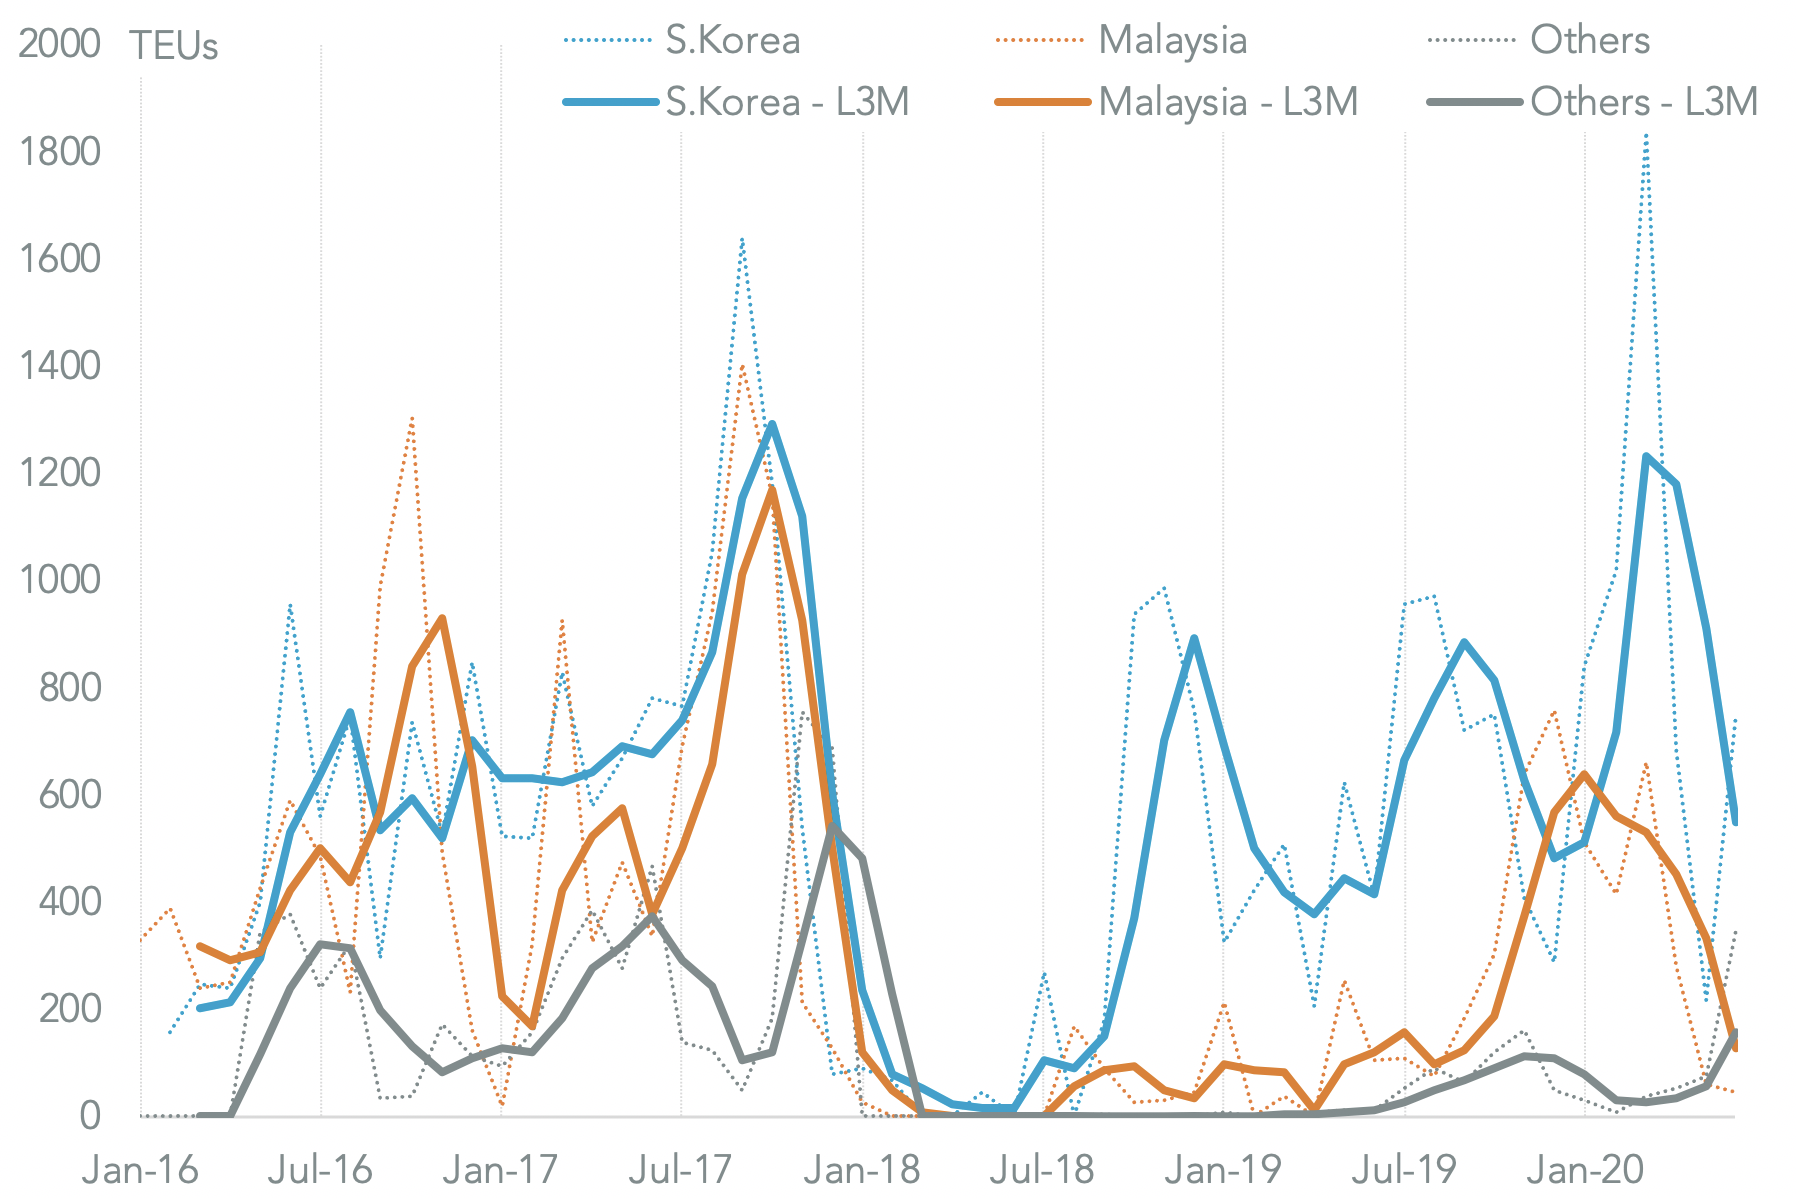
U.S. solar power supply chains have faced significant upheavals in the past 10 years, ranging from significant support under the Obama administration and a surge in shipments from China that were capped by tariffs, through to the Trump administration’s widespread use of import duties. A surge in imports started in late 2019 despite section 201 duties with shipments in the 12 months to May 31 reaching $7.96 billion or just 4.2% below their all time high. The growth has likely extended with a 65.9% year over year increase in seaborne imports in Q2’20.
That’s raised concerns about oversupply, with many projects not yet backed by power sales agreements according to S&P Global Market Intelligence. The Q2 shipment surge has been driven by a 132.2% jump in shipments from Vietnam, including improved shipments by East Group and First Solar, as well as a 76.8% rise in imports from South Korea.
The shifting import duties have led many importers to switch their supply base. The share of Hanwha Q Cells’s share U.S. shipments coming from South Korea rose to 67.9% of the total in H2’20 from 43.1% in 2016, which has come at the expense of its imports from Malaysia.
Source: Panjiva
#5 Biden’s supply chain strategy has implications for Baxter, Reckitt Benckiser (July 13)
Former Vice President Joe Biden has released a new strategy for bolstering supply chains in the wake of COVID-19 as part of his general election campaign. The strategy will include more extensive use of the Defense Production Act, federal procurement strategies and payments for surge capacity in healthcare products. There’ll also be a pause in negotiating major new trade deals until the process of bolstering supply chains is completed.
U.S. imports of products needed for the diagnosis and treatment of COVID-19 were worth $31.9 billion in the 12 months to May 31 and rose by 36.4% year over year in May due to increased pharmaceutical shipments. Manufacturers of pharmaceuticals will need to decide whether to move production to the U.S. or continue to ship from other countries.
In Q2 the growth in U.S. imports of pharmaceuticals needed for COVID-19 included a 51x surge in shipments linked to Baxter, a 109% rise in imports associated with Granules India and a 63.2% jump in imports linked to Reckitt Benckiser.

Source: Panjiva
#6 Export sentiment improving, but still not out of COVID-19 woods (July 1)
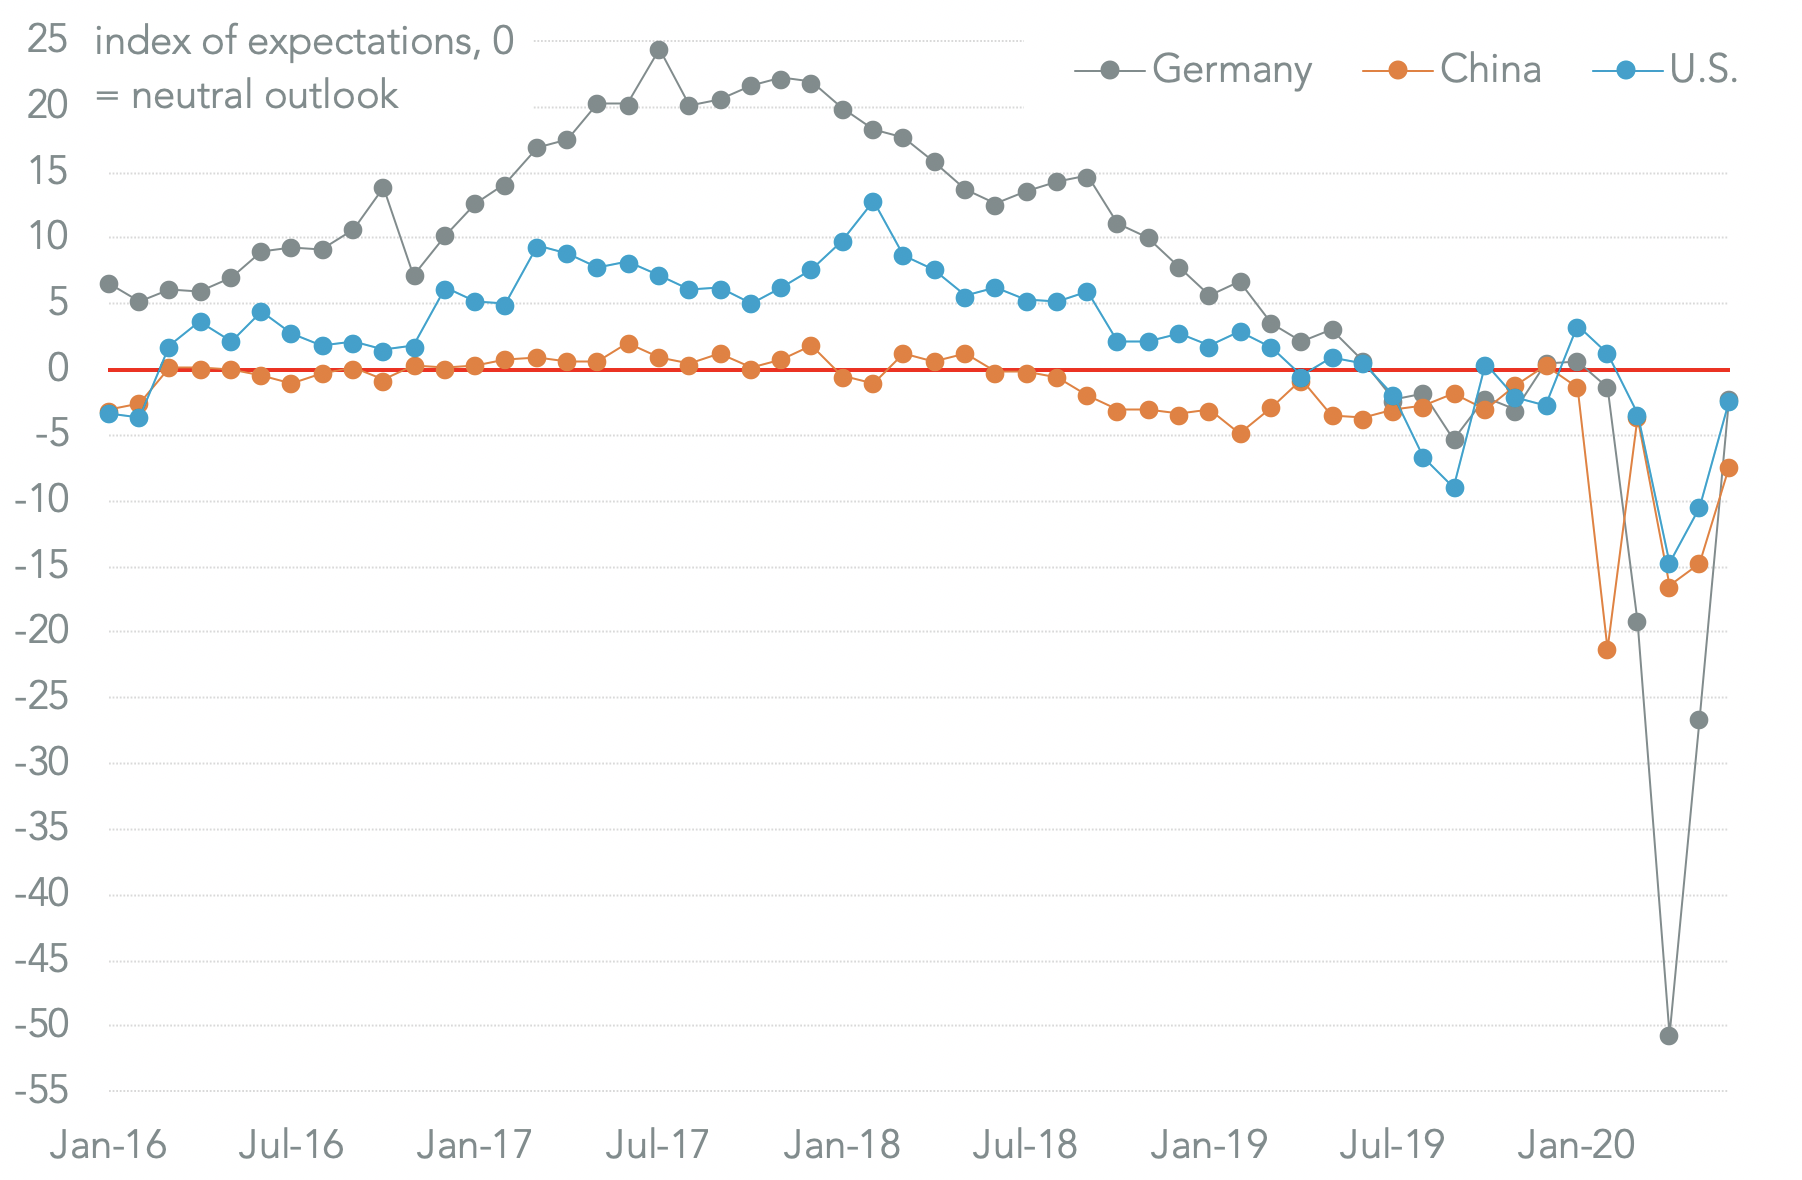
International trade sentiment improved among U.S. businesses in June, according to the latest ISM survey, with an export reading of 47.6 versus 39.5 a month earlier. That’s still below the neutral (50) level suggesting there are still challenges during the recovery period after COVID-19.
Indeed, with only three of 18 sectors reporting higher exports – as well as import sentiment also remaining negative – it’s clear that firms with longer supply chains are struggling to recover. The U.S. result of improving, but still negative, export sentiment is similar to the pattern being seen in Germany and China, suggesting the global recovery from COVID-19 has a ways to go yet.
Source: Panjiva
#7 Medical supply sourcing slowdown gives impetus to reshoring strategy (July 29)
U.S. imports of medical supplies needed to tackle COVID-19 may be slowing. Shipments of PPE, ventilators and pharmaceuticals all fell in the first half of July versus June on a daily average basis. Shipments of ventilators dropped by 26.6% sequentially while PPE and pharmaceuticals fell by 21.6% and 1.8% respectively.
Within PPE, masks dropped by 24.0% after improving in prior months due to increased shipments by Walgreens among others. While shipments of gloves improved by 9.6% sequentially in July, the latter may be complicated by the detention of imports linked to Top Glove due to forced labor accusations.
The newly launched “U.S. MADE” Act, as well as proposals from the Trump administration and the Biden campaign, look to cut America’s reliance on China, which represented 90.0% of U.S. seaborne imports of masks in 2020 so far.

Source: Panjiva
#8 Retailers have tough peak season choices with COVID-19 recovery, trade war risks (July 17)
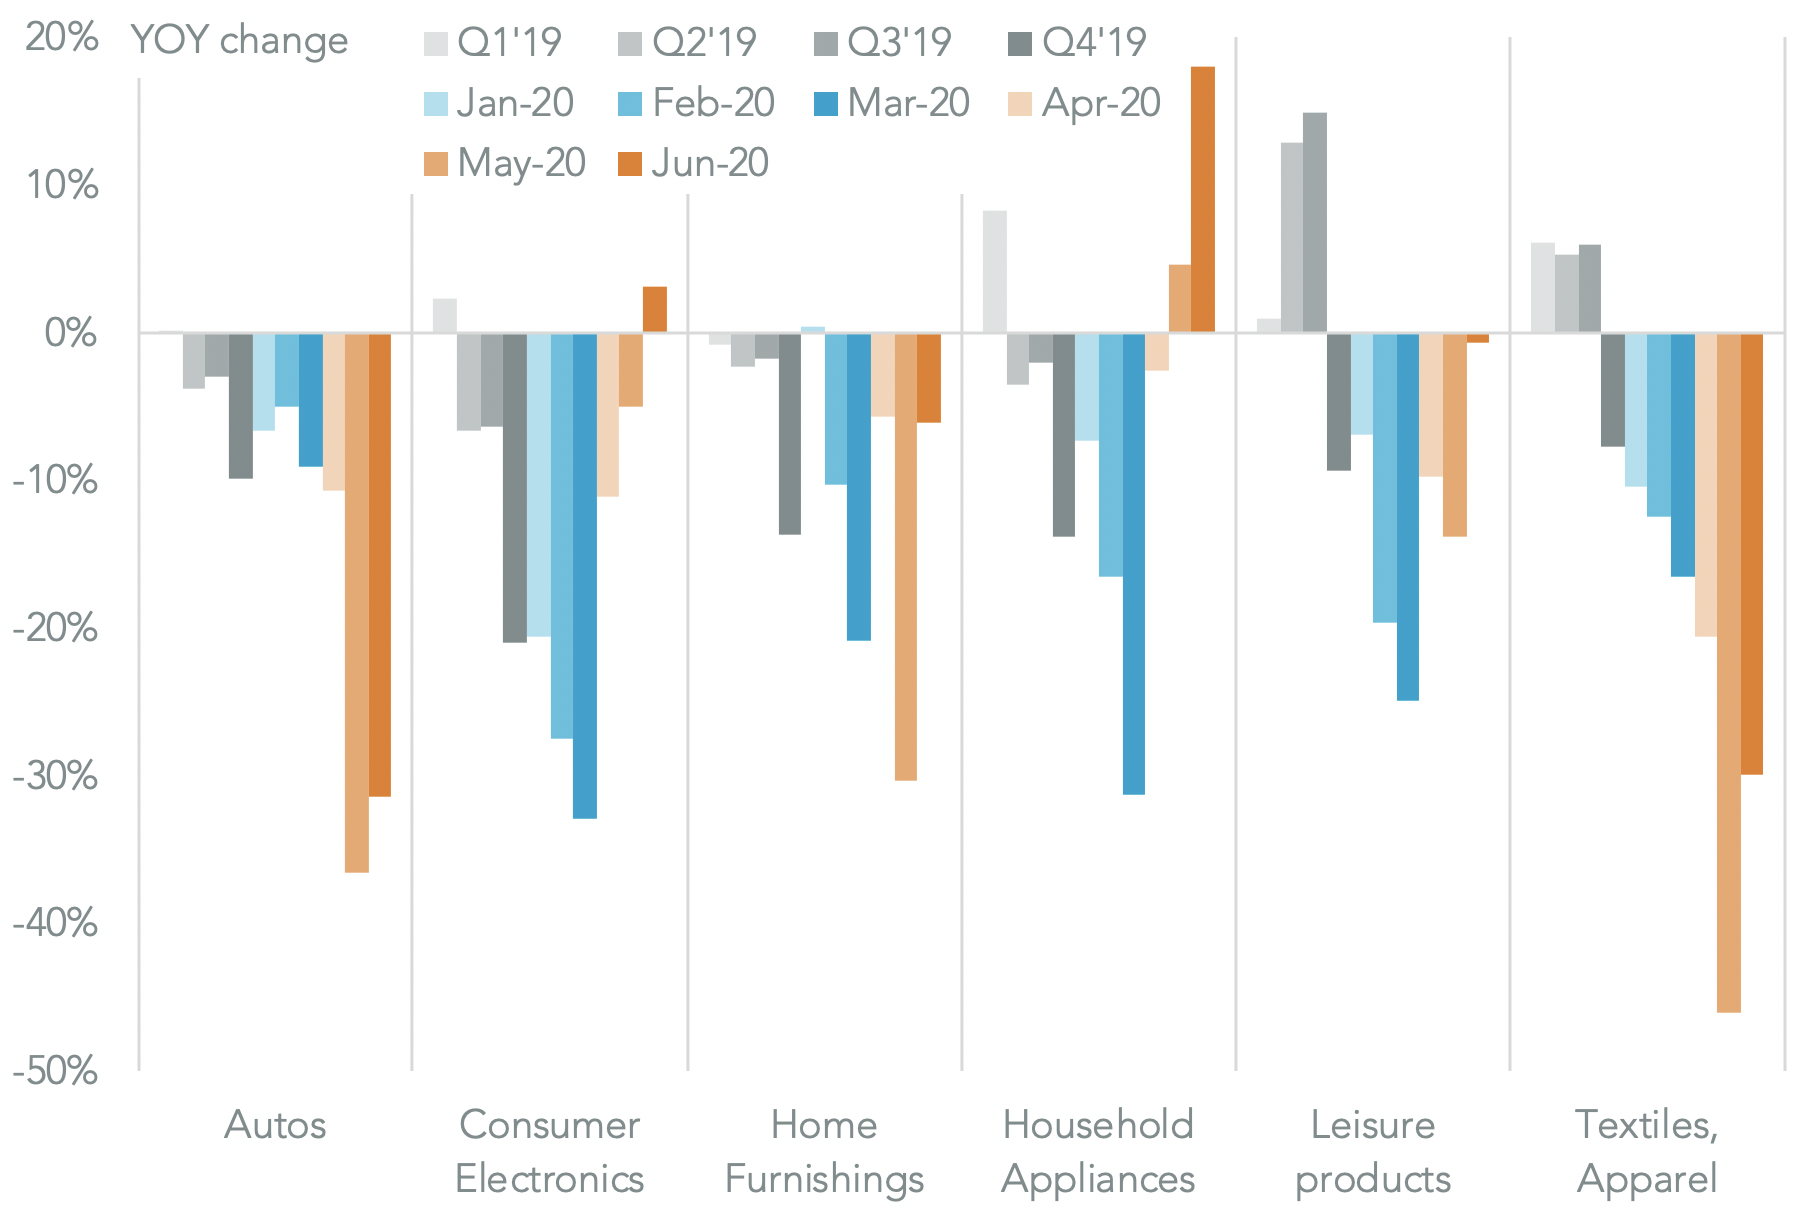
U.S. retail sales have started to pick up after COVID-19 lockdowns have been relaxed with total sales rising 2.9% year over year in June. Yet, that’s largely down to food, gas and autos with furniture and clothing down by 27.8% and 5.0% respectively. Importers of consumer goods are left with tough choices to make ahead of the peak shopping season.
Total U.S. imports of consumer discretionary products fell by 12.9% year over year in June due to a slump in the autos sector. Home furnishings and apparel dropped by 6.1% and 29.9% respectively, the latter including the effect of bankruptcies.
Electricals meanwhile did better with appliances up by 18.0% and consumer electronics increased by 3.2%. Aside from peak season demand uncertainties there is a risk that the U.S.-China trade war restarts, potentially triggering a round of stockpiling later in the year.
Source: Panjiva
#9 COVID-19 causes container complications; Maersk’s reefer handling grows (July 24)
The COVID-19 pandemic has caused disruptions to the technical side of the logistics industry. One challenge has been in ensuring that empty containers are in the right place at the right time. In the first six months of 2020 there’s been an average 18.5% year over year drop in the handling of empty containers by nine U.S. ports tracked by Panjiva.
By contrast, handling of full containers fell by just 8.5%. The change in empty container handling has been more volatile than that for full containers every month in 2020. There may also be a tightening in the availability of empty refrigerated containers (reefers) after extended inspections in China.
Demand for reefer handling has increased with U.S. seaborne imports rising by 6.8% year over year in June. That included a 26.2% surge in shipments handled by Maersk and a 19.4% slide in those handled by Tropical Shipping.

Source: Panjiva
#10 JBS, Marfrig face China’s widening COVID-19 farm good restrictions (July 1)
The Chinese government has extended its restrictions on farm imports because of COVID-19 transmission concerns. Those have previously covered shipments from the U.S., possibly as a part of wide trade tensions, and now include suppliers in Brazil, Canada and Germany. Brazilian chicken and beef are targeted. China represented 20.3% of Brazilian poultry exports in the 12 months to April 30 and was the fastest growing destination market in the three months to April 30.
Growth was led by BRF with a 15.4% increase in the three months to April 30 while JBS, one of the targets for restrictions, saw imports unchanged. Beef exports to China meanwhile surged 96.8% higher year over year in the month of April after a 23.9% increase in Q1. Minerva grew the fastest in April compared to a year earlier while Marfrig’s, another target for restrictions, increased by 133.0% while JBS’s rose by 73.4%.

Source: Panjiva


