 Es
EsThe U.S.-China trade war has likely continued to take a toll on U.S. imports in November. U.S. seaborne imports fell 4.2% year over year in November, Panjiva’s data shows. That marks the third straight month of decline, though it was a slightly slower rate than the 8.7% seen in October.
Containerized freight activity declined slightly quicker than bulk with a 5.7% slide which was also a slower decline than a month earlier. The slide in shipment volumes suggests the decline in total U.S. trade seen in October, discussed in Panjiva’s research of Dec. 6, is set to continue amid overall slowing demand for imports.

Source: Panjiva
The slowdown has been largely due to the depressive effects of the trade war with China. Imports from China dropped 12.7% in November after an 18.8% slide a month earlier.
Excluding China there was a 2.1% rise in imports from the rest of the world, led by a 38.3% surge in imports from Vietnam, 29.5% from Singapore and 11.9% from Thailand.
The laggards in Asia includes India and Japan, though the latter’s 21.6% drop did compare to an unusual surge a year earlier.
The growth in imports from Europe recovered to a 3.5% expansion compared to an earlier decline. There may be a surge in shipments in the coming months ahead of proposed U.S. tariffs on imports from France, Italy, Austria and potentially the U.K. in relation to digital services taxes.

Source: Panjiva
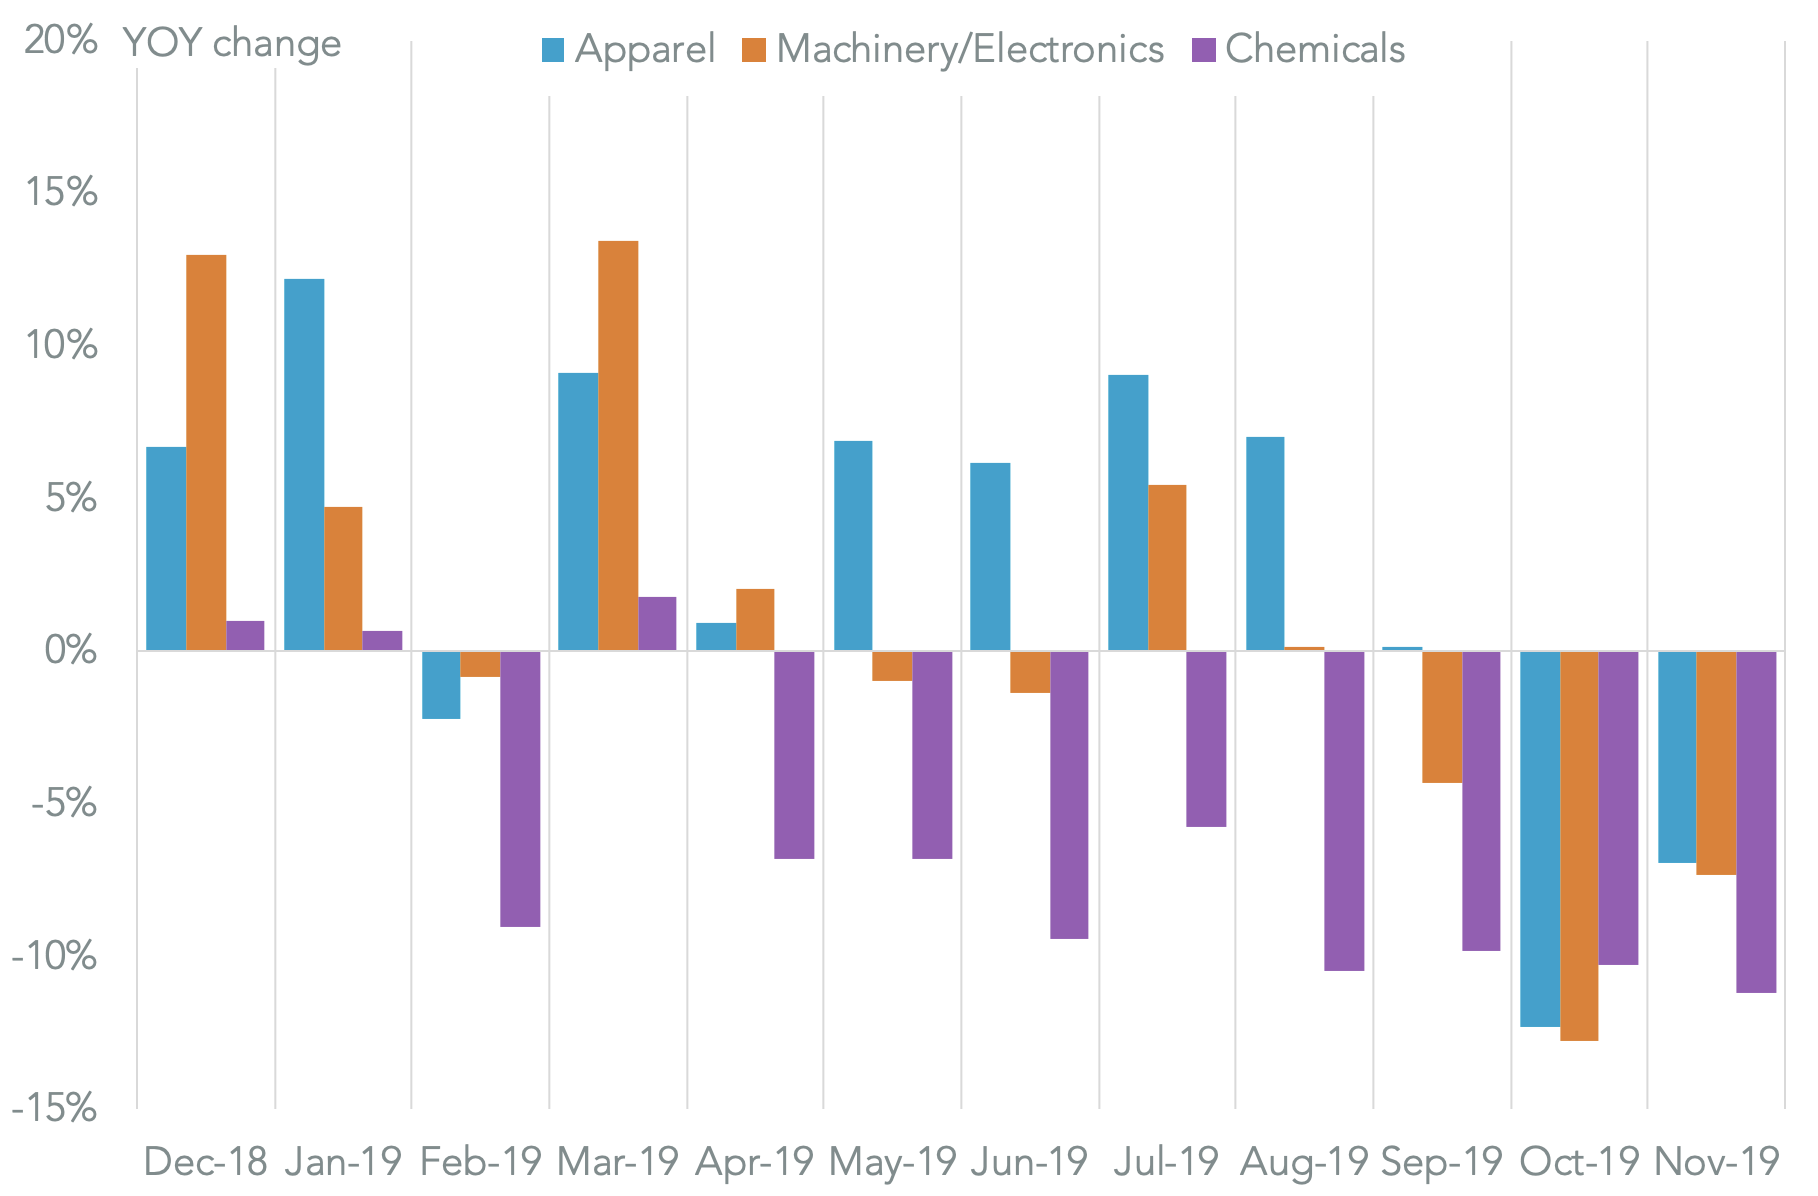
At the product line the extension of tariffs on imports from China to “list 4A” products can be seen in a decline in apparel imports of 7.0%. The slowdown in exports has been widespread though with shipments of machinery and electricals falling for a third month by 7.4% while chemicals – where tariffs have been applied since July 2018 – are still in decline with an 11.2% drop.
Source: Panjiva
The apparel sector shows that tariffs are not the only reason for a decline in imports. While shipments of apparel from China fell by 12.9% year over year in November, shipments from the rest of the world dropped by 1.2%. There’s either been onshoring or – more likely – a slip in demand for imported clothes from retailers.

Source: Panjiva


