 Es
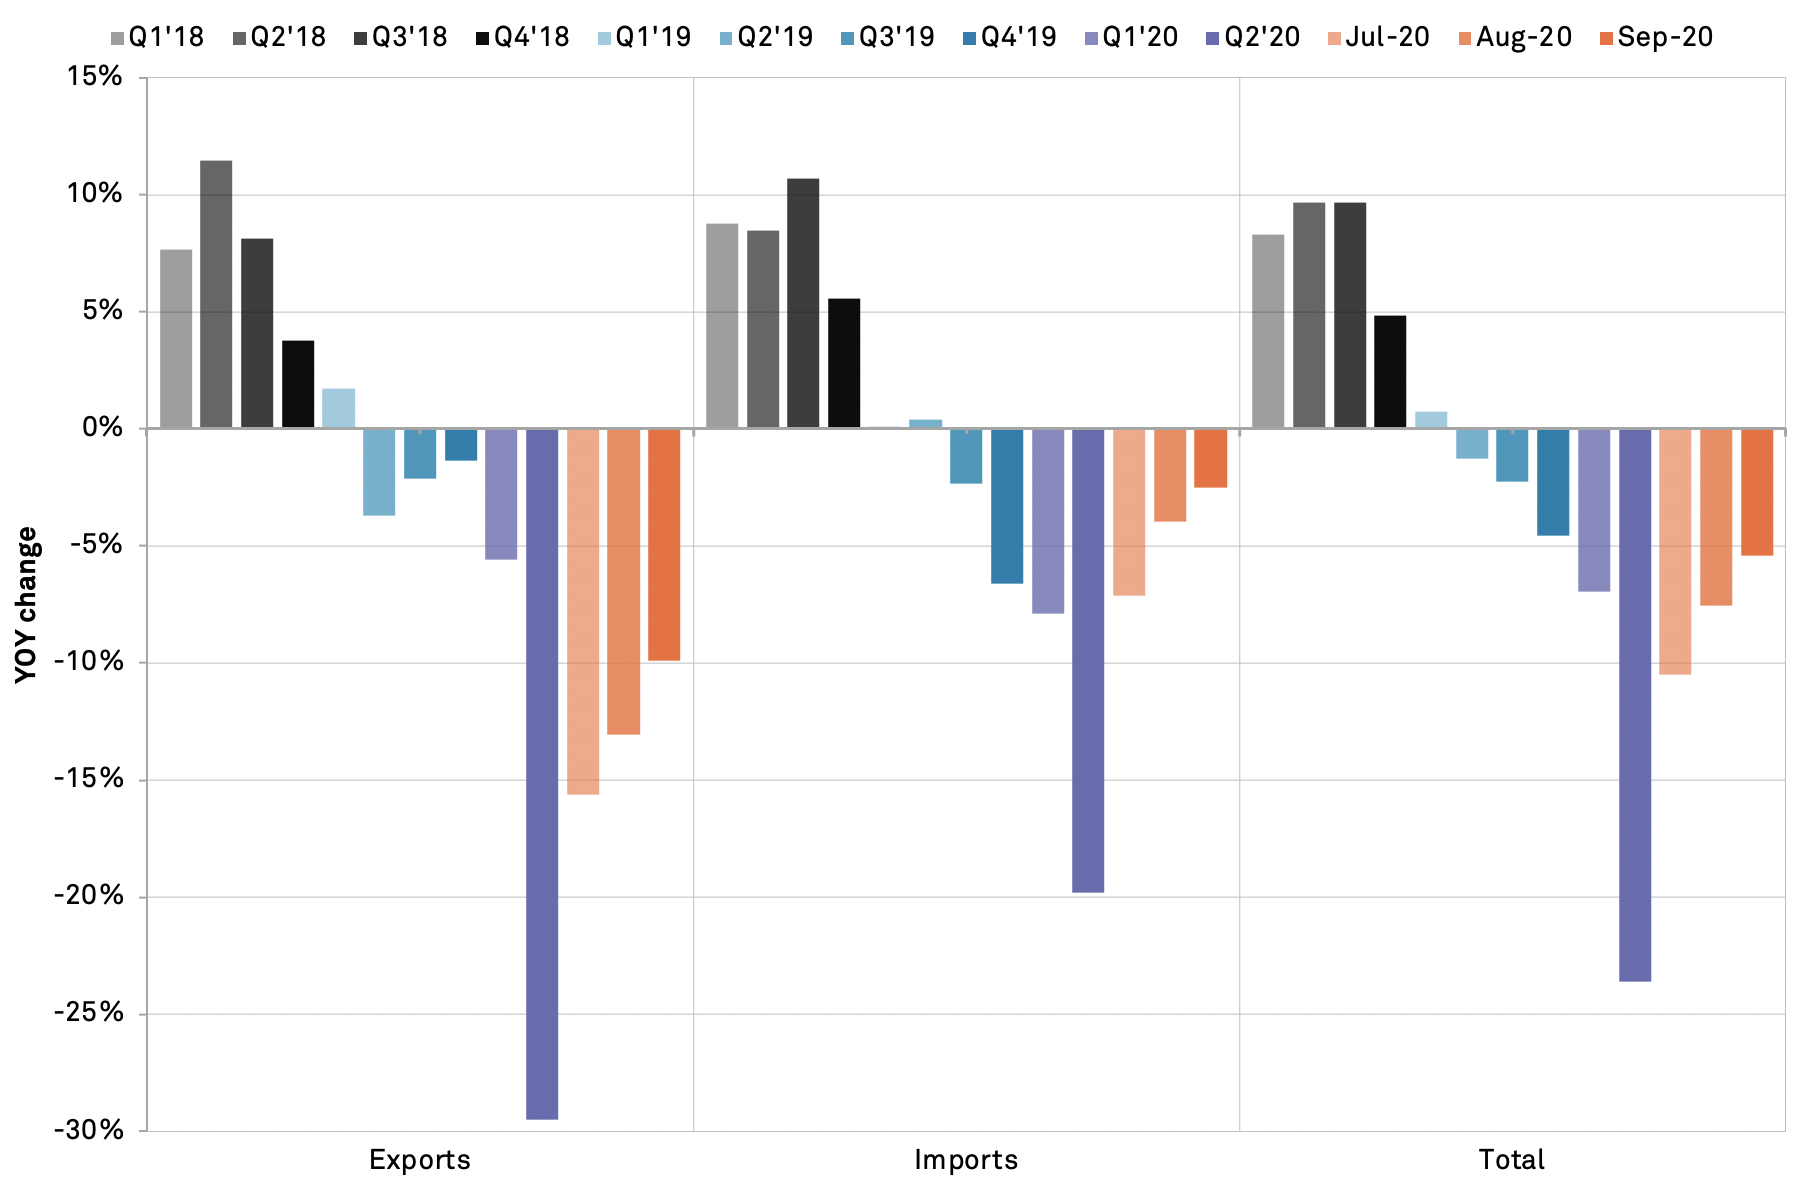
EsU.S. international trade activity continued to wane in September, with total merchandise trade having dropped by 5.4% year over year after a 7.6% drop in August, Panjiva’s analysis of official data shows. Imports returned close to recovery with a drip of just 2.5% year over year led by a rebound in shipments of consumer goods – which increased by 2.0% – and autos which improved by 0.7%.
Seaborne shipments, as shown in Panjiva’s Oct. 12 research, have recovered significantly quicker which may reflect a marked reduction in import values, reduced airfreight as well as a drag from commodity prices. Full trade figures and a diagnosis of the difference will have to wait until after the elections on Nov. 4.
Exports remained depressed with shipments down by 9.9%. As a consequence the trade-in-goods deficit reached $79.4 billion. That was smaller than the prior month but still 11.6% higher than a year earlier. It also meant that the trailing 12 month deficit, a key metric for the Trump administration, reached $910.7 billion which was 13.9% higher than in 2016.
Source: Panjiva
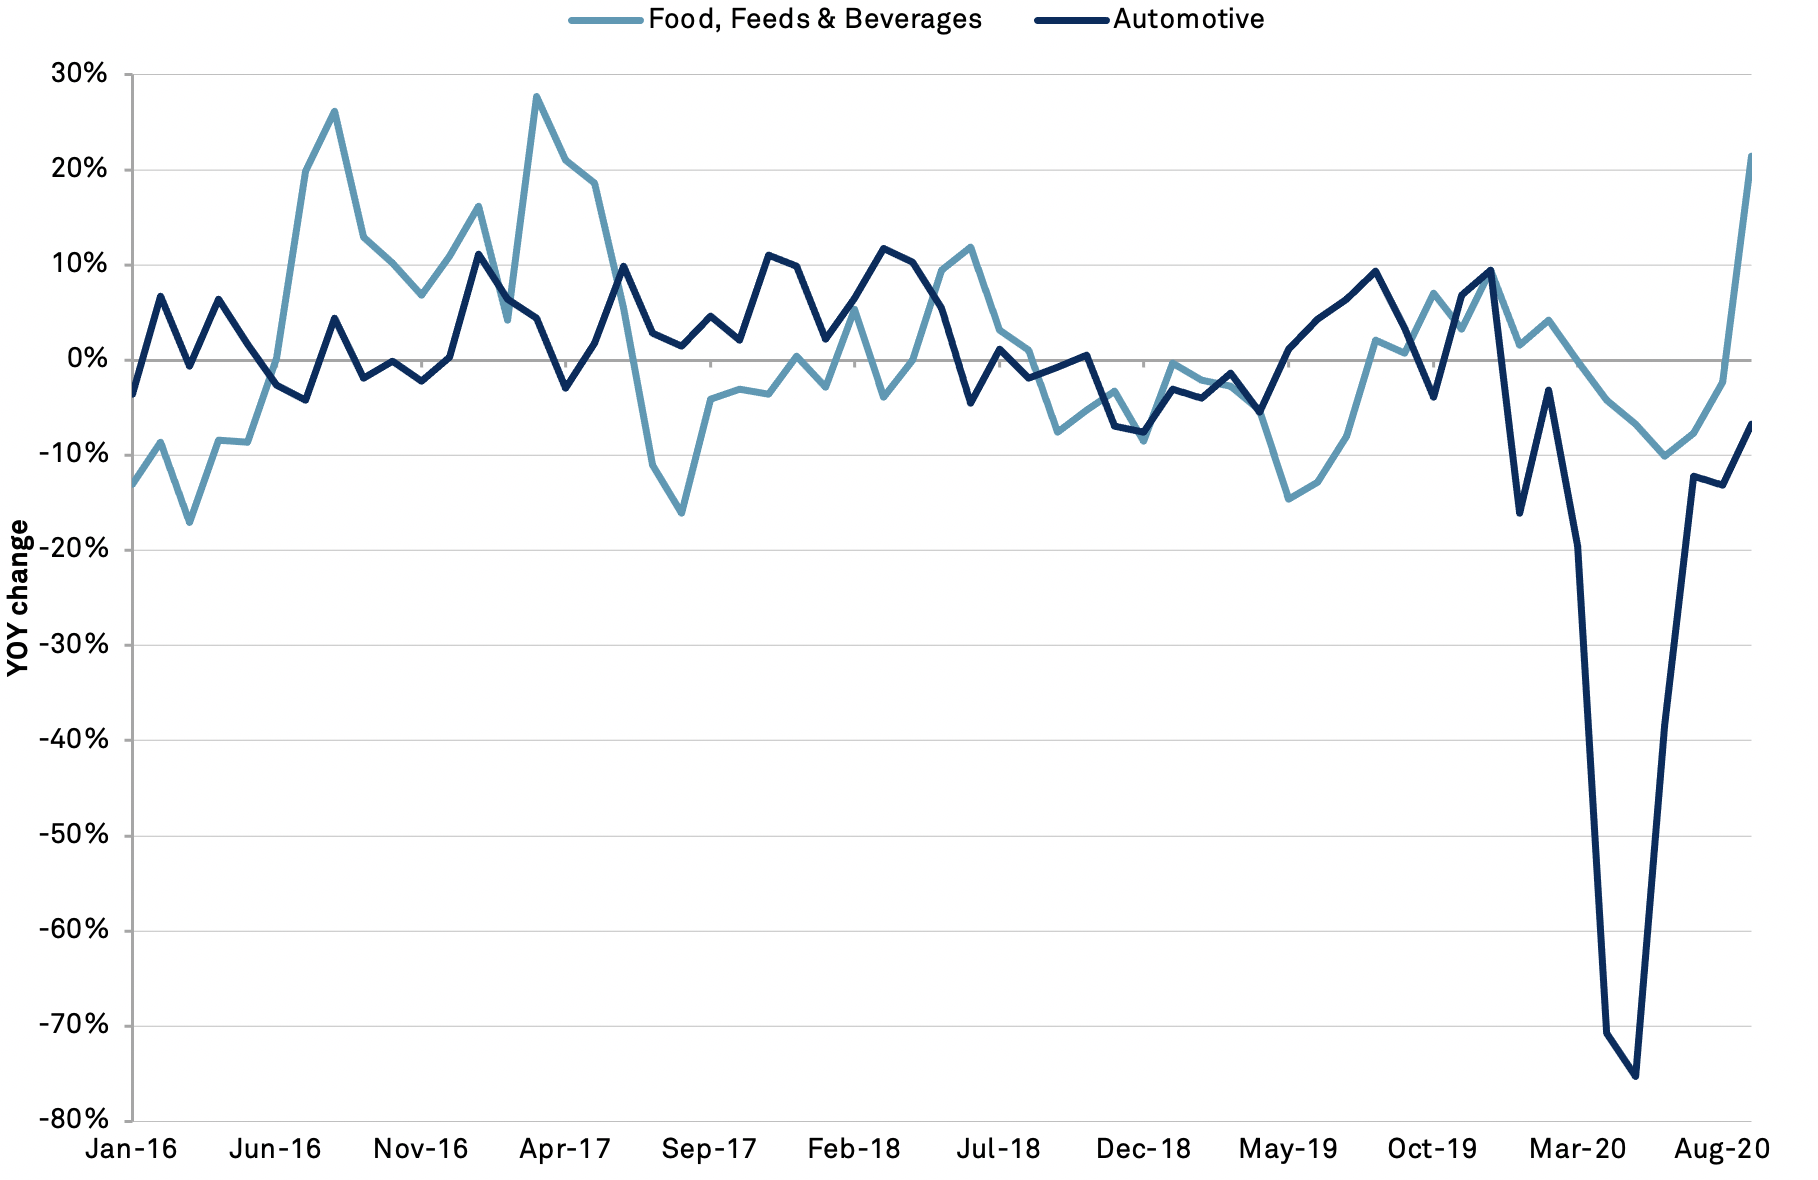
The mix of export activity was very unbalanced. Food and beverages surged 21.4% higher, reversing a 2.3% dip a month earlier, suggesting that China’s purchases of farm goods, flagged in Panjiva’s Oct. 27 research, are having a material effect. Most other export lines continued to decline by a double digit amount, however, though the downturn in autos exports slowed to just 6.8%, the slowest rate of decline since February.
Source: Panjiva


