Es
EsGlobal supply chains, logistics and international trade policy all dealt with another year of upheaval in 2019. This report reviews five data-points that summarize the tumult and provides some pointers for the road ahead.
The world entered an export recession
Whether one wants to blame the trade war, oil, the dollar or the lateness of the economic cycle there was a slowdown in global trade throughout 2019. Panjiva analysis of the exports from 37 countries including the EU showed a 1.6% decline year over year in the 12 months to Oct. 31. There’s been an acceleration throughout the year with a drop of 3.0% in October following a 2.0% slide in 3Q.
While the rot initially set in in Europe, the downturn is currently being led by sliding exports in Asia. While trade policy has become less clouded at the end of 2019, business sentiment remains broadly negative and the risks of a U.S.-EU trade war are just starting to arise.
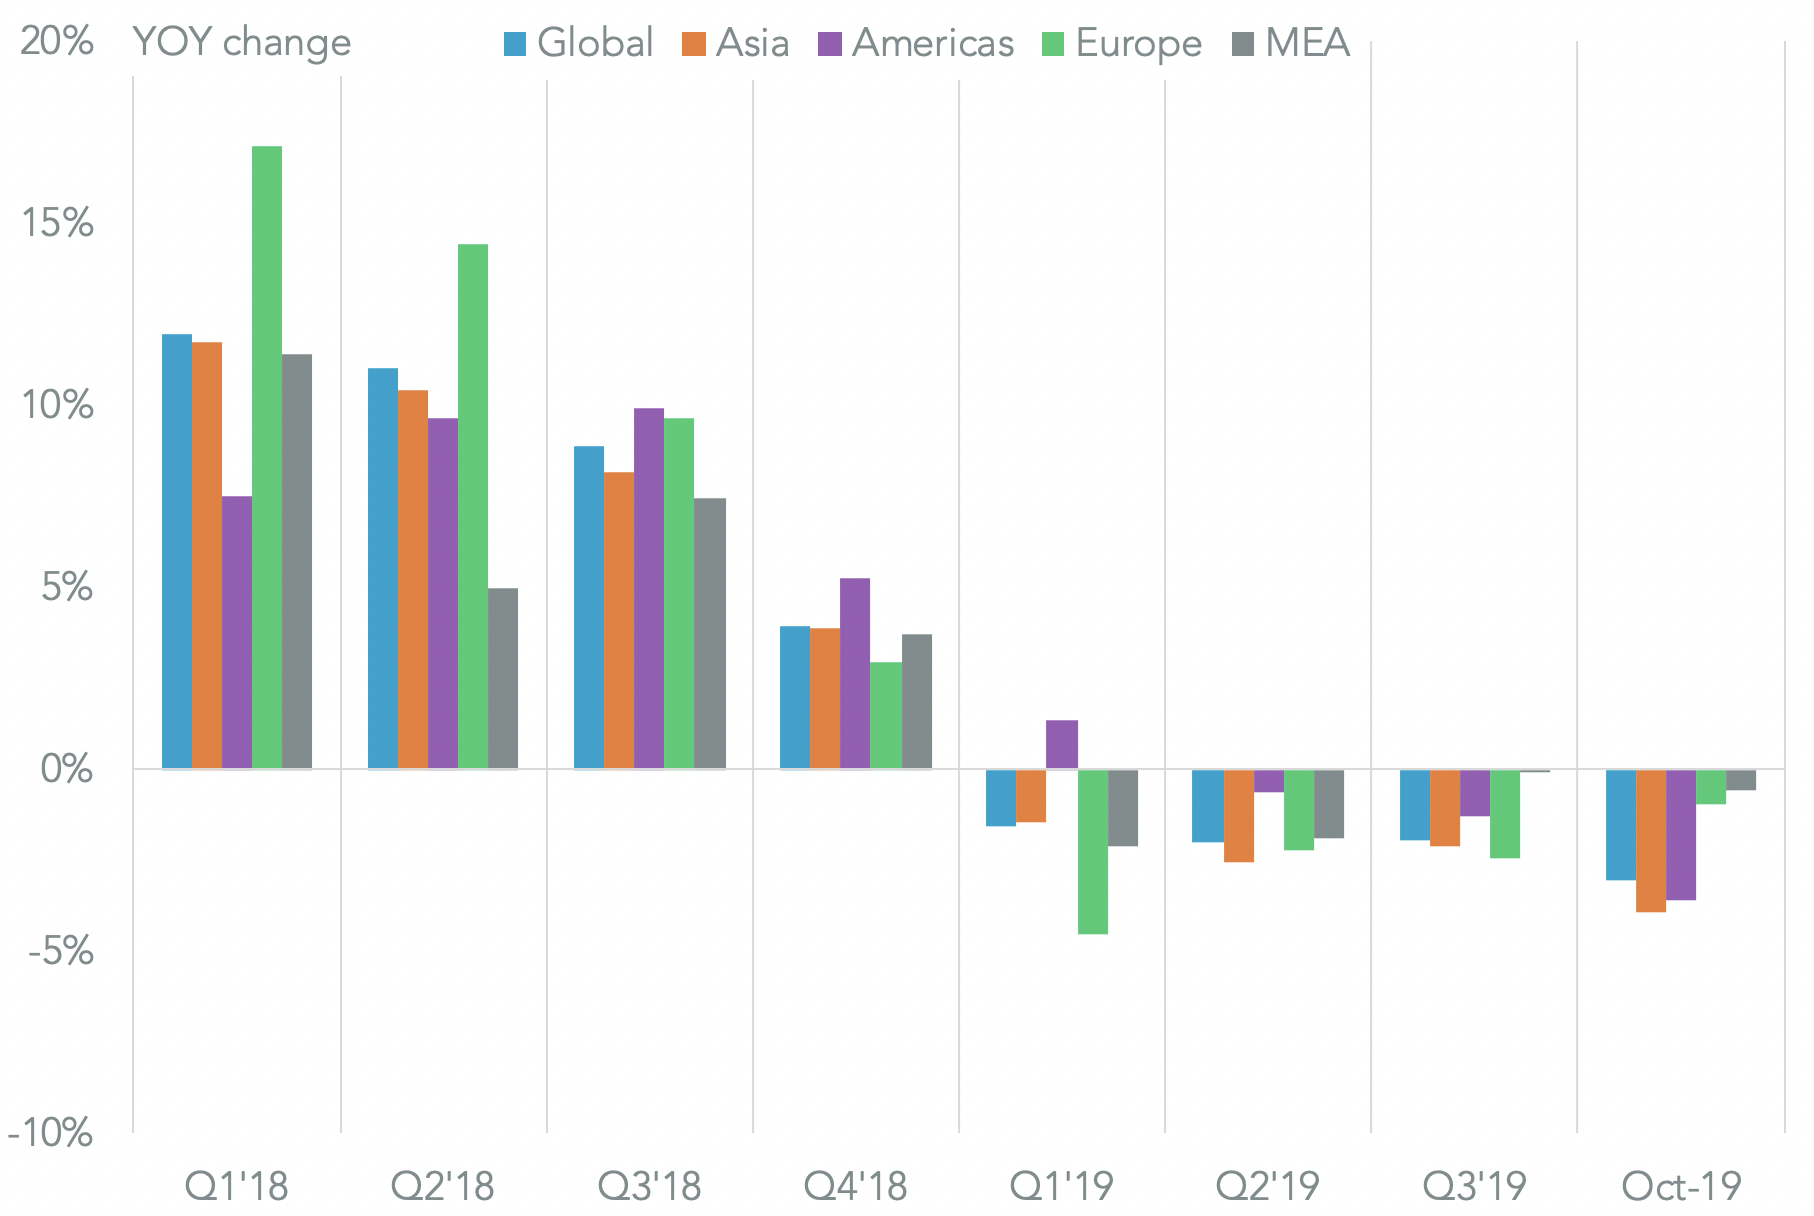
Source: Panjiva
The trade war took its toll
The U.S.-China trade war took its toll on international trade activity in 2019, with bilateral trade between the two countries having fallen by 15.2% year over year in the 12 months to Nov. 30, Panjiva’s analysis of official data shows.
The recent phase 1 trade deal between the two countries, outlined in Panjiva’s research of Dec. 16, would suggest that the Trump administration has “won”. Yet, when comparing the past 12 months to 2017 the data shows China’s purchases from the US fell by 21.6% compared to 2017 while its shipments to the US only fell by 2.2%. With the phase 1 purchasing commitments yet to be finalized and enforcement detailed it will continue to pay to track the trade data closely.

Source: Panjiva
Trump’s favorite fairness metric was down, but not out
The trade deficit is the Trump administration’s #1 guide to the fairness of trade relations. The trade war has succeeded in cutting the US trade deficit with China by 10.2% in the 12 months to Oct. 31 vs a year earlier, Panjiva’s data for U.S. imports and exports shows. However, it’s still up by 6.4% compared to 2016.
The next challenge will be with the EU – the second largest contributor to the deficit where there’s been a 6.4% rise in the past 12 months and 22.4% since 2016. The U.S. Trade Representative has already stated the deficit is “focused” on the deficit with the EU according to the Financial Times, with a spat regarding digital services taxes already underway.
With the noise of trade war and Brexit it was also easy to miss that the renegotiation of the U.S.-Mexico-Canada Agreement was finally completed. Yet, the deficit with Canada and Mexico has grown even faster than that with the EU.
It’s also worth noting that the total deficit is still up 0.7% year over year in the past 12 months at $871 billion and is 18.2% higher than in 2016. A continued increase could rapidly lead to a new round of tariff salvoes.
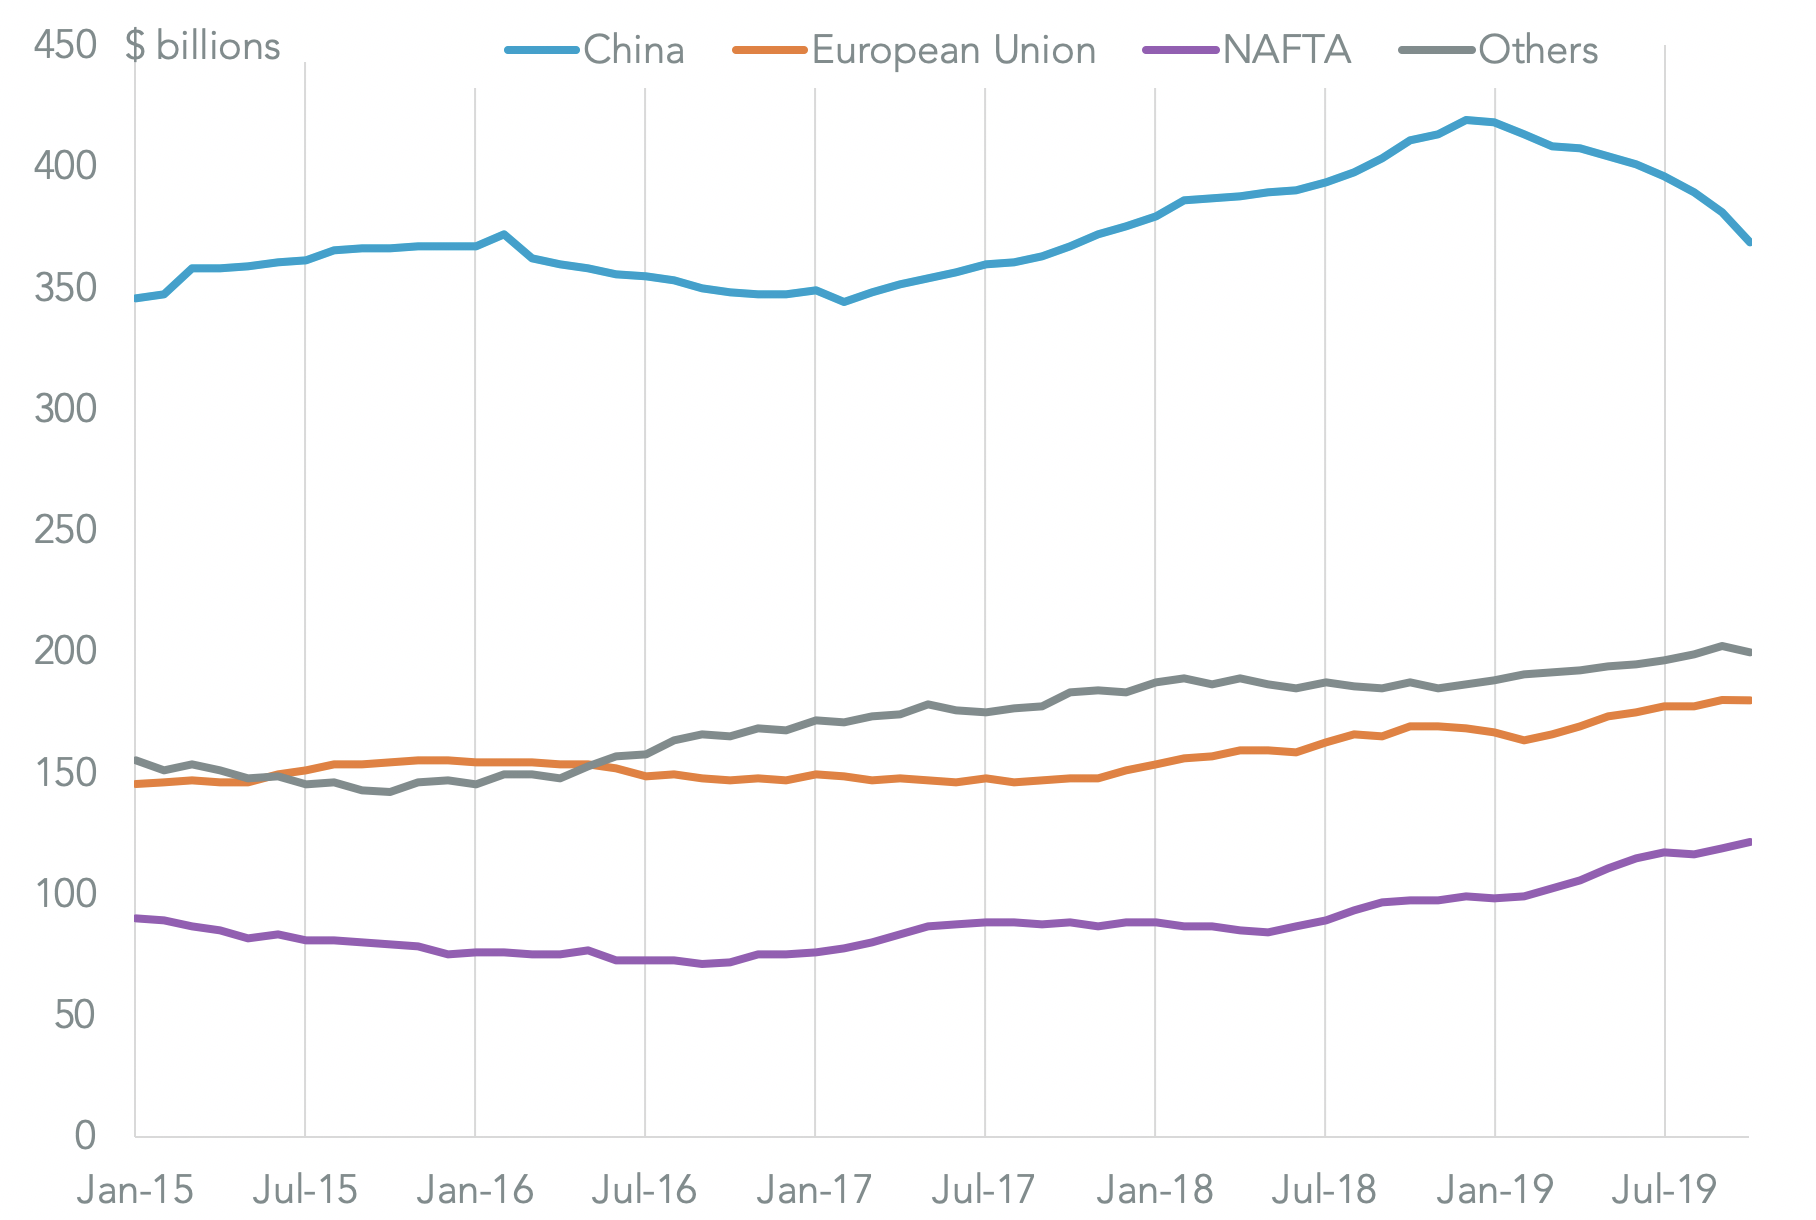
Source: Panjiva
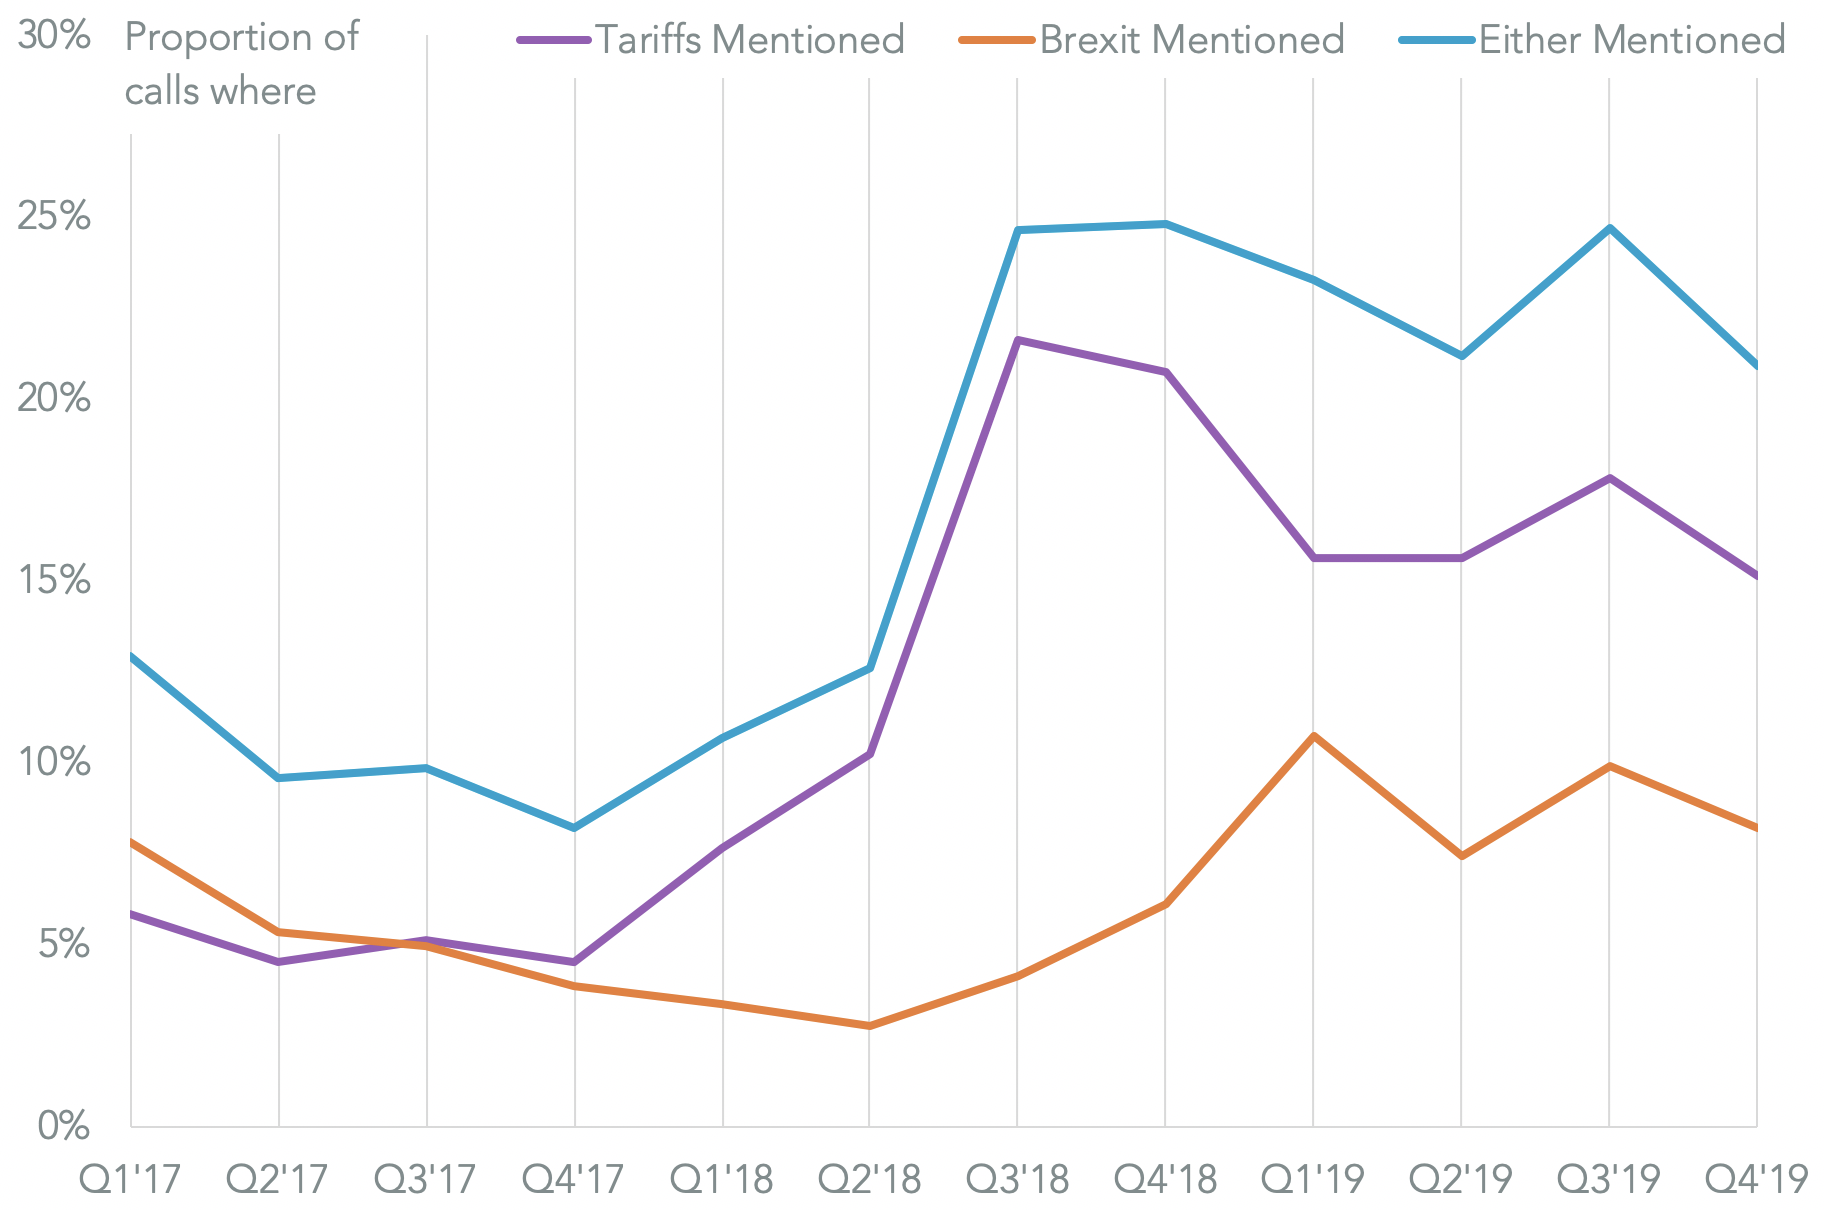
Trade policy became a business-as-usual factor for companies
The proportion of company conference calls mentioning either tariffs or Brexit fell to 20.9% of the total since Oct. 31. That compares to 24.7% in the prior quarter and was the lowest ratio since 2Q 2018. That would suggest that – despite all the newsflow and volatility – that trade policy volatility is now a fact of life for corporations and investors. The improved visibility regarding U.S.-China relations and Brexit may lead to an even more sanguine attitude in the new year.
Source: Panjiva
Getting ahead of Brexit
The British election on Dec. 12 has set the course for Brexit in 2020. The transitional arrangements which apply from Jan. 31 to Dec. 31 will give time for the British and European governments to negotiate long-term trading arrangements.
Yet, British industrial firms are not waiting for Brexit to occur to update their supply chains. The proportion of intermediate industrial supplies and equipment sourced from the EU fell to 45.9% of the total in the 12 months to Oct. 31, compared to 48.5% in 2016 and 51.6% in 2015, Panjiva’s analysis of ONS data shows.

Source: Panjiva