Es
EsThe logistics industry had a relatively quiet 2019 after three years of falling traffic and rates, financial failures and consolidation. It enters 2020 facing a series of challenges relating to fuel costs, activity levels, the need for efficiency improvements and the opportunities from consolidation.

Source: Panjiva
Dealing with environmental and fuel factors
Container shipping rates recovered in 2019 and have started 2020 at the highest level since April 2015, Panjiva’s analysis of Shanghai Shipping Exchange data shows.
Yet, that’s largely been driven by higher fuel costs. Panjiva’s analysis of S&P Global Platts data shows the average bunker-excluded rate on Asia-Europe lanes average $852/FEU in 4Q on average versus $924/FEU a year earlier. Similarly Asia-U.S. West Coast bunker-excluded rates fell to $1009/FEU in 4Q compared to $1909/FEU a year earlier.
There’s been a better start to 2020 with Asia-Europe rates having improved more recently to $1134/FEU though Asia-U.S. rates are closer to levels seen throughout 4Q.
Aside from fuel costs, there may also be challenges from securing the specific low-sulfur fuels needed to ensure continued operation without expensive investments in sulfur-scrubbing or alternative fueling such as LNG.
Indeed, there’s already evidence of fuel shortages in India, Splash247 reports, which higher fuel costs and access have potentially caused financing issues for Pacific International according to Lloyds List.
The container-lines don’t just face higher costs due to sulfur emissions. There’s a rising risk of regulation of carbon dioxide emissions which could add a further 3% to transatlantic shipping costs as outlined in Panjiva’s Dec. 4 analysis from joining the EU emissions trading scheme. There may also be a unilateral bunker fuel charge from the EU.
The industry may look to take matters into its own hands with the International Chamber of Shipping proposing a $2 per ton levy on bunker fuel to create a $500 million per year fund to help mitigate emissions. For context bunker fuel costs are currently around $360 per ton S&P Global Platts, leaving the levy equivalent to just a 0.5% increase.

Source: Panjiva
Parlous pricing power
The container shipping industry faces a persistent lack of pricing power. That’s shown by the struggle to build profits in the face of higher fuel costs as well as the EU likely maintaining the block exemption for shipping alliances.
While profitability improved to an 11.1% EBITDA margin across eight container-lines in 3Q, Panjiva’s analysis of S&P Global Market Intelligence data shows, that was largely down to a change in lease accounting standards by the European shippers.
Outside Europeans there’s generally little change in margins. For example Evergreen’s EBITDA margin fell by 0.3% points in 3Q versus a year earlier while Yang Ming and Matson saw increases of just 0.1% and 0.2% respectively.
Additionally it should be noted that the 3Q margin for the sector is only back to levels seen in 3Q 2017 despite the impact of accounting changes. The year-over-year drop in bunker-excluded rates flagged above may have eaten into profits in 4Q and may require action in the form of efficiency improvements in 2020.

Source: Panjiva
Productivity investments still needed
The shipping industry has not been shy of investing in new capacity increases including Inland ports, port expansion, larger vessels and automation. The latter has lagged somewhat after a period of industrial unrest that appears to have been cured.
That may change. Panjiva’s analysis of official data show waterborne employment’s steady downturn continued for a sixth month out of the past seven with a 1.9% drop year over year drop in December. At 63,700 payrolls that was the lowest in absolute terms since Jun. 2012.
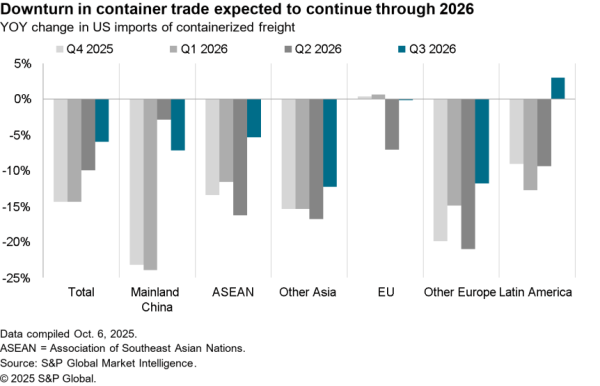
There’s a clear link to the downturn in seaborne shipping. Panjiva’s data shows seaborne imports to U.S. ports fell by 10.6% year over year in December. There’s a risk of further cutbacks in activity despite the forthcoming phase 1 trade deal between the U.S. and China.
In the 2011 to Q3’19 period the average productivity of the sector – expressed as the change in average shipments less the change in average employment – improved by around 3.0% points annually.
In 4Q that figure may have dropped to an 8.0% decline as average shipments fell by 8.7% and employment only fell by 0.7%. The knock-on risk is that ports and shipping firms aim to improve that ratio by cutting jobs. In turn that would increase the risk of strike action and further disruption to U.S. supply chains.

Source: Panjiva
On-again, off-again consolidation
Room for consolidation among the container-lines may be close to done given the top 10 already account for 87.4% of U.S. seaborne imports in 2019. It’s more likely that the sector continues to pursue vertical integration. Initial moves by CMA-CGM in buying Ceva Logistics and Maersk‘s integration of Damco more recently indicating desire to buy more landside assets.
Consolidation within the forwarder sector also took a step ahead in 2019 with DSV-Panalpina, though there has been little action in late 2019. We may see a return to dealmaking once uncertainties around shipping costs as well as the status of U.S.-China trade policy are resolved.
Unlike the container-lines, the freight forwarding sector is still heavily fragmented with specific geographic focuses. Panjiva data shows the top 10 freight forwarders only represented a 14.1% market share of U.S. seaborne imports in 2019, or 1/6th the level of consolidation in container-lines.
Potential combinations may rely on the right mix of service offerings across land, sea and air important – as shown by DSV-Panalpina and the integration of container-ines and forwarders – as well as geographic coverage. On the latter it may make sense to see consolidation lef by European-centric forwarders such as K+N and DB Schenker with 46.4% and 42.7% respectively of their U.S.-traffic coming from Europe. They may be interested in combining with more Asia-centric operators such as Honour Lane where 97.3% of traffic to the U.S. came from Asia, as well as OEC at 95.9% and Kerry with 88.8%.

Source: Panjiva