 Es
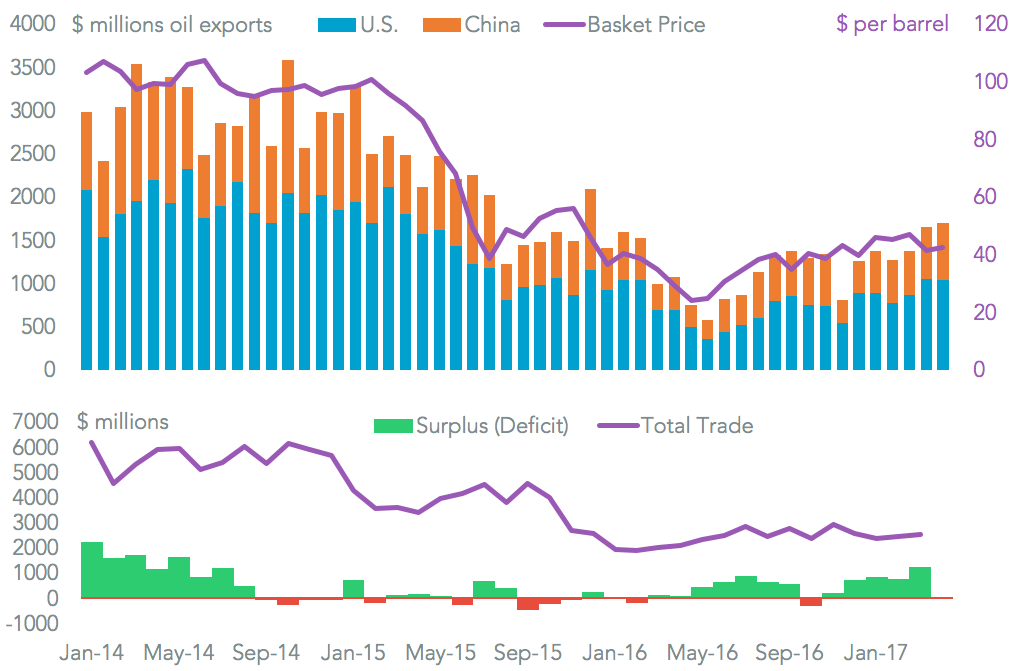
Es#1 Venezuela’s $10 billion sanctions risk (June 5) The U.S. government was reported to be considering sanctions against Venezuela, starting with restrictions on trade with PdVSA. Exports of oil the U.S. are worth $10 billion annually, our data shows, without which Venezuela would run a $3 billion deficit. Chevron and Valero would need alternative supplies.
Source: Panjiva
#2 14 Trade events for this summer (June 15) Our preview proved to be hopelessly optimistic in expecting action on reviews of steel and aluminum and the Omnibus report on causes of the deficit by the end of June. The month of July will bring those, along with the end of the 100 day negotiating period with China, the NAFTA negotiating plan and a Canadian aerospace review.
#3 Ford and Tesla head to China (June 21) Both automakers announced plans to build new factories in China for a mixture of cost (Ford) and market access (Tesla) reasons. We identified Ford’s dwindling Mexican exports and Tesla’s rocketing Chinese imports as indicators of strategic motive.
#4 Expeditors loses ground at sea (June 13) Our monthly review of NVOCC market share showed Expeditors lost 0.2% points of market share of U.S.-inbound, seaborne traffic. CH Robinson picked up share, while DB-Schenker became the fifth-largest.
#5 Trump’s aluminum urgency (June 13) Our deep-dive into U.S. aluminum trade showed a 37% rise in the value of imports in April, reaching their highest since at least 2009. That came as aluminum purchasers began to complain about the Trump administration’s potential trade restrictions.
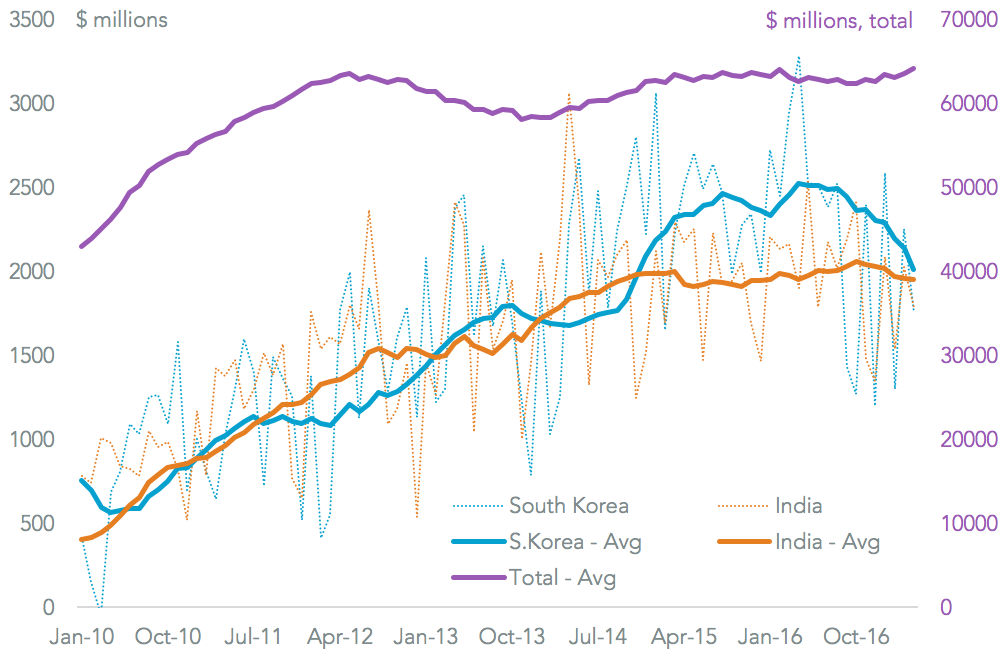
#6 $47 billion at stake in two meetings (June 22) President Donald Trump met with the heads of state of both India and South Korea late in the month (see below). We identified the trade position of the two relative to the U.S., flagging the absence of easy wins for trade with India and risks to the KORUS trade deal.
Source: Panjiva
#7 British political meltdown after election (June 9) The ruling Conservative Party’s loss of a majority in the British parliament will make Brexit negotiations more complicated. We analyzed the electoral math and flagged the potential for a “softer” stance on leaving the EU as well as the risks to the EU’s trade with the rest of the world.
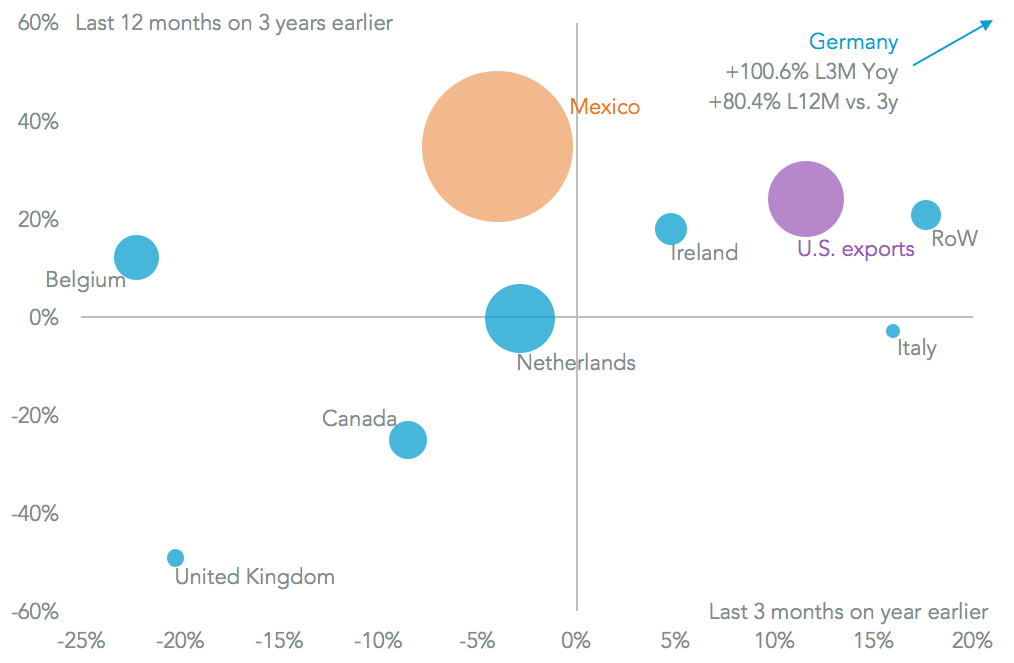
#8 Why South Korea is like Mexico (June 28) A more detailed look at South Korea’s trade dealings with the U.S. showed is mixture of deficit and existing trade deal, along with high proportion of automotive trade makes South Korea look a lot like Mexico. The starting point for future developments could be increased South Korean investment in the U.S.
#9 Vietnam under the Omnibus (June 26) Our (in hindsight premature) preview of the result of the U.S. Omnibus review of the causes of the trade deficit flagged Vietnam as a high-risk target. It has the sixth largest trade surplus vs. the U.S., and has been the third largest contibutor to the U.S. trade deficit’s expansion.
#10 Au revoir Paris, bonjour le vent (June 1) President Donald Trump’s withdrawal from the Paris Climate Accords raises the risk of a less “green” domestic energy policy. Importers may have anticipated this, with imports of wind turbine kit in May reaching 2.2-times their November level.
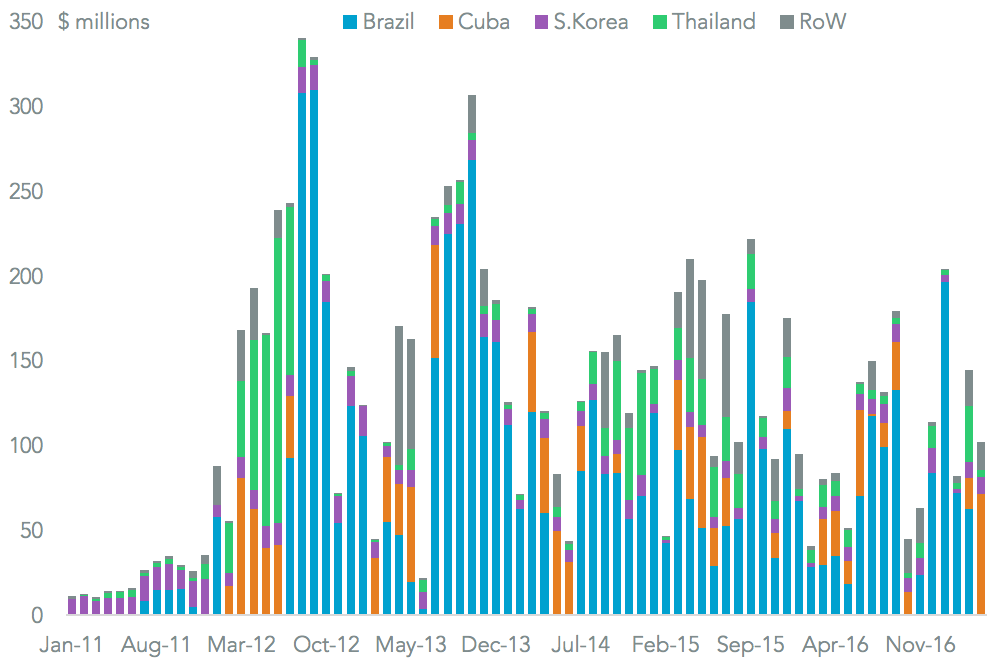
#11 Ross sweetens sugar talks (June 6) Ahead of an agreement being reached between the U.S. and Mexico on sugar trade mid-month, we previewed the read-through for NAFTA talks, and contrasted it to failed talks between Brazil and China.
Source: Panjiva
#12 Spanish dockers revolting (June 20) June was a challenging month for Maersk (it also suffered cyber-security disruptions), with strikes in Spain causing disruptions. We highlighted the most exposed carriers and routes, with Maersk and MSC representing 43% of Spain-to-U.S. sailings on just two routes.
#13 Maersk strikes a confident pose (June 15) Earlier in the month Maersk’s CEO confirmed the company is on track for its financial targets and is expanding its market share. Our data for U.S. inbound traffic and Brazilian handling highlighted the rapid pace of market share growth in both.
#14 CMA-CGM opens its checkbook (June 14) Maersk’s market share will drop a little though after it sold its Brazilian cabotage operations to CMA-CGM, which will build its share of that market by 0.2% points to 9.5%.
#15 Qatar (not) solo (June 12) The diplomatic moves by six countries including Saudi Arabia against Qatar led to lower oil prices and tanker rates (down 9% and 11% in the first week). The impact on container shipping was minimal. Meanwhile the U.S. inked a $12 billion military aircraft deal shortly afterwards.
#16 Cerveza vs. bier vs. beer (June 28) Our monthly deep-dive into the beer industry highlighted rising exports of beer from Mexico to the U.S. and China, though German beers in U.S. were the best performers.
Source: Panjiva
#17 Looking for strength in energy week (June 26) We previewed the “energy week” policy focus of the Trump administration, and identified $35.3 billion of potential export growth across liquefied natural gas, oil and coal without significant policy changes needed.
#18 Modi and Trump call for creativity (June 27) Prime Minister Modi and President Trump called for a “comprehensive review” of trade relations and identification of “creative ways” of increasing trade. Deals in LNG and aerospace provided a starting point.
#19 Weak below the Surface (June 20) Our monthly review of the PC industry showed U.S. imports dropped as much as 18% in May, with all-in-one machines (including Microsoft’s Surface) being a rare area of growth.
#20 Waiting for the tariff axe to fall (June 8) The U.S. import boom continued in May, with our early read of seaborne data highlighting a 4% increase in shipments led by autos (up 22%) and steel (18%) as buyers perhaps anticipated tariffs to come in July.

Source: Panjiva


