Es
EsThe Japanese Prime Minister, Shinzo Abe, is scheduled to meet with U.S. President Donald Trump on Friday. The topics for discussion will include trade and investment, the Wall Street Journal reports, including increased trade in liquefied natural gas, $150 billion of Japanese investment in U.S. infrastructure and cooperation in other areas including robotics and AI.
President Trump will likely want to focus on industrial manufacturing, especially automotive where he has been critical of Japanese manufacturers, as discussed in Panjiva research of January 6. Japan was also the largest signatory, aside from the U.S. of the Trans-Pacific Partnership. It has therefore already had significant trade negotiations with the U.S. despite Mr. Trump having pulled out of it.
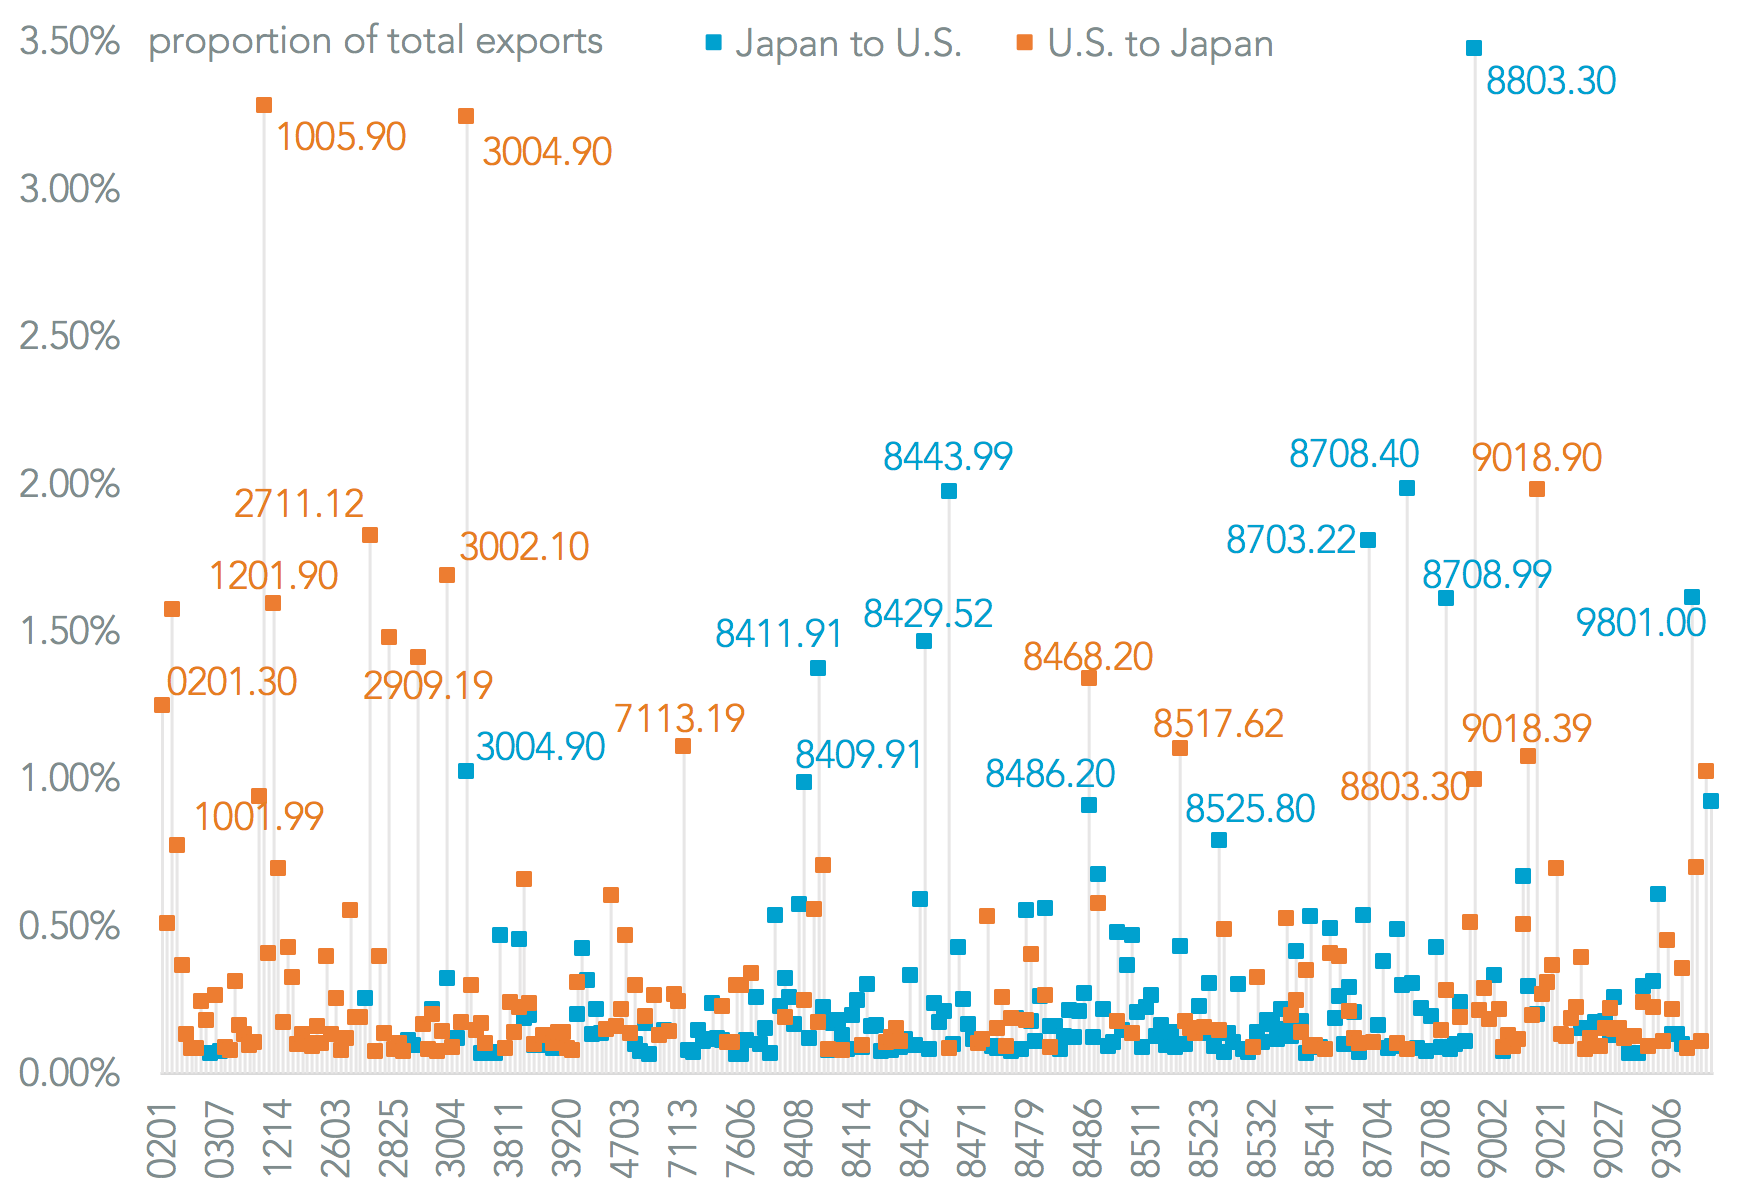
Panjiva’s analysis of each country’s top 200 export lines (defined by HS 6 code using U.S. export and import data) reveals where each party’s pain points may be in future negotiations:
There are two categories that matter significantly – Japanese exports of mid-sized autos to the U.S., which accounted for 27.5% of the total in the 12 months to November 2016, and U.S. exports of aircraft which were 10.5%.
There are subtleties within those two that make simple retribution difficult – 3.47% of Japan’s exports to the U.S. are aerospace parts. Outside those areas though Japan’s exports were more diversified, with each category representing 0.282% of the total vs. 0.332% for the U.S.
There is also little in the way of two-way trade – only 75 of the 325 export lines analyzed had two-way trade (ie both country’s exported the same product to each other). Two major areas where there is co-dependence in in pharmaceuticals (3.25% of U.S. exports, 1.02% of Japanese exports) and semiconductor manufacturing equipment (1.34% of U.S. exports, 0.91% of Japanese exports).
The biggest divergence between the two, as shown in the chart below, is in food and beverages. The major categories (HS 01 through 24, including 33 specific lines) including raw and processed food and beverages accounted for 15.3% of U.S. exports to Japan vs. only 0.14% of Japanese exports to the U.S. It is the farmers and foodmakers of the U.S., therefore, that may be Mr. Abe’s closest allies.
Source: Panjiva