 Es
EsIn an interview with Bloomberg, Commerce Secretary Wilbur Ross stated on NAFTA that it would be “the latter part of this year before real negotiations” can start, and that he hopes talks won’t take “substantially more than a year”. Practically speaking no talks with Mexico and Canada can happen, at least under Trade Promotion Authority, until Congress has had a 90 day period to consider the administration’s negotiating position. Without indulging in a modern day exercise of “Kremlinology”, Secretary Ross’s comments suggest a new version of NAFTA could take until 2018 to deliver.
While President Trump prefers bilateral deals, Secretary Ross commented in the same interview that he retains an “open mind” on how the renegotiation of NAFTA works noting “it’s the end result that matters”.
Positioning the talks as trilateral may actually be counterproductive for Mexico and Canada. While it enables them to represent some common points of leverage, these are limited, as outlined in Panjiva research of February 22. Additionally, Mexico and Canada’s trade with each other is small compared to their trade with the U.S., running the risk that Mexico-vs-Canada issues complicate and slow the talks down. That may tempt the U.S. administration to act unilaterally.
Panjiva’s analysis of interactions between the three countries shows trade between the U.S. and Mexico has grown consistently more quickly than the other two pairings. U.S. exports to Mexico grew 5.0% in the quarter to January 31 vs. a year earlier, and 16% over 12 months vs. five years earlier. Mexican exports to the U.S. actually expanded more slowly, with 4% growth in the past quarter and 11.5% over five years. Canada’s trade with Mexico is small in context for both at less than 5% of their trade with the U.S.
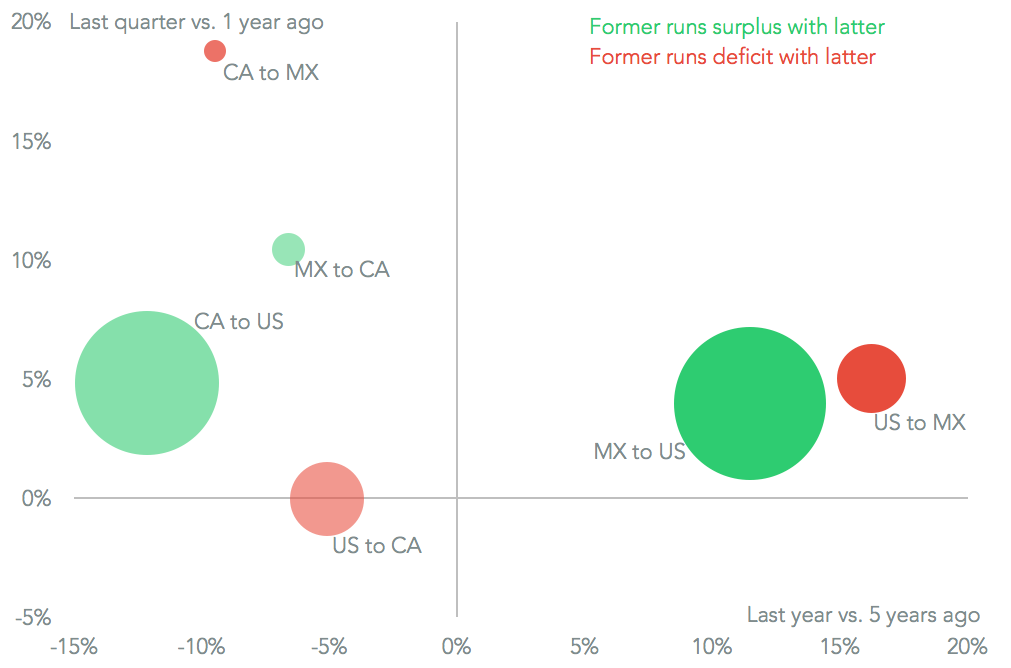
Source: Panjiva


