Es
EsThe U.S. and Chinese governments will meet from Jan. 13 to finalize a phase 1 trade deal South China Morning Post report. The potential signing of a deal raises the question as to whether the Trump administration’s tariff pressure has “worked”.
On two levels it has – China has come to the table and talks are close to a conclusion while the U.S. trade deficit with China has fallen by 30.4% year over year in November as outlined in Panjiva’s research of Jan. 8.
The latter was the result of U.S. imports from China falling by 21.6%, marking the 11th straight decline, Panjiva data shows. Exports meanwhile have jumped 17.4%, only the second improvement since Jul. 2018. Both provide good optics ahead of the phase 1 deal announcement though there is further to go given the U.S. deficit with China in the past 12 months was still $357 billion versus $347 billion in 2016.

Source: Panjiva
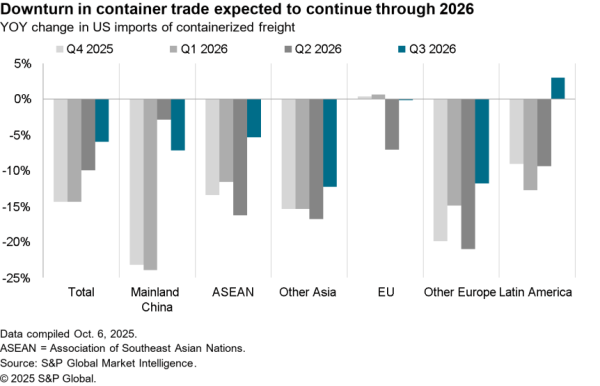
The need for a continued decline in the trade deficit along the need to ensure bilateral compliance with the terms of the phase 1 deal explains the continuation of most tariffs that have been imposed between July 2018 and September 2019.
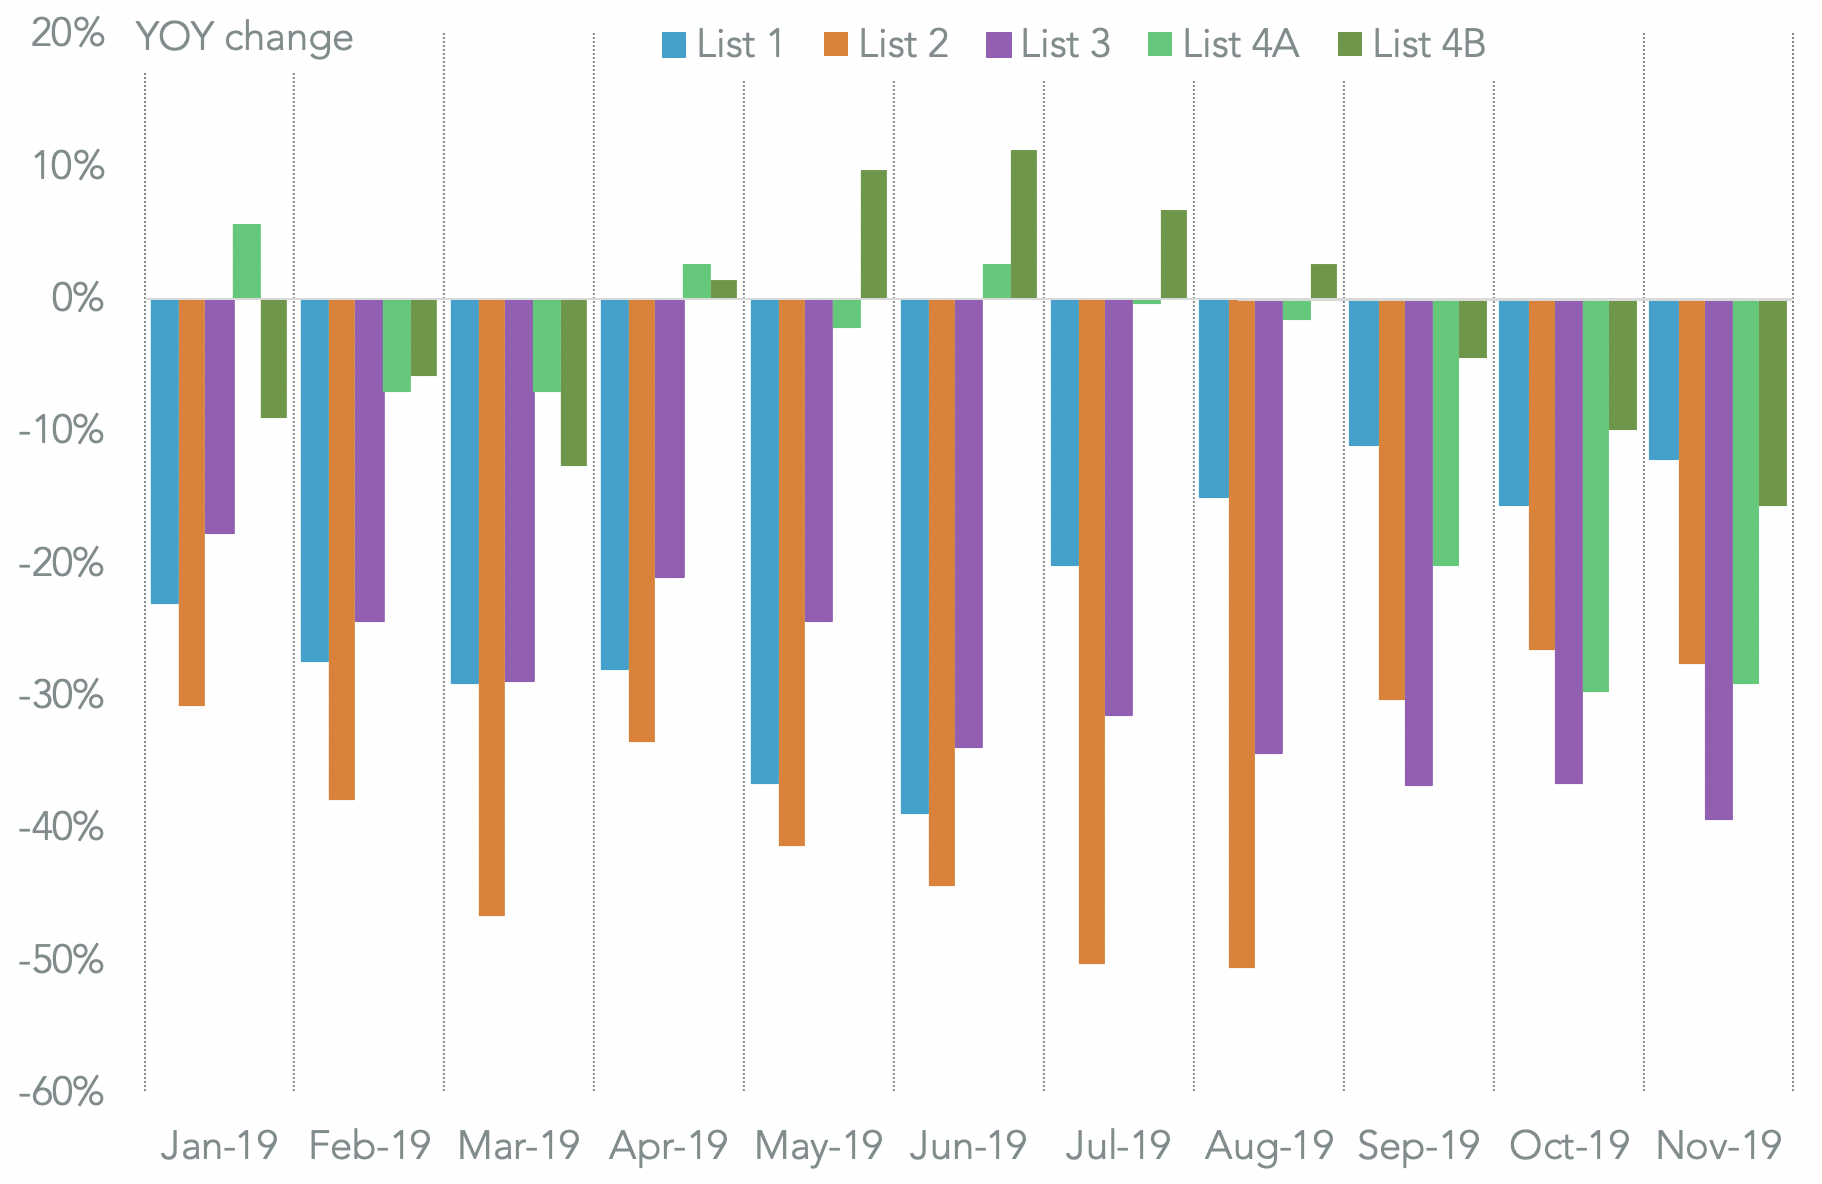
Panjiva analysis shows that there has been a downturn in all four section 301 tariff categories. There was a 35.6% slide in imports of list 1-3 products – applied at a 25% rate – despite all tariffs having been in place for over a year already. That partly reflects an increase in list 3 tariffs to 25% in May 2018 resulting in a 39.3% drop in imports for that class in November compared to 36.6% in the prior three months.
Imports of list 4A products which mostly includes consumer products at a 15% rate since September fell 29.2% in November. The prospect of a cut in the rate to 7.5% may mitigate that decline. At the product line the fastest decline in dollar terms in that group was a 76.0% slump in flat panel television imports, Panjiva data shows, including a significant switch to imports from Mexico.
The threat of widened tariffs does not appear to have affected imports of list 4B products where tariffs due in December were abandoned. Earlier stockpiling likely drove the 15.7% slide in imports of that product group.
Source: Panjiva
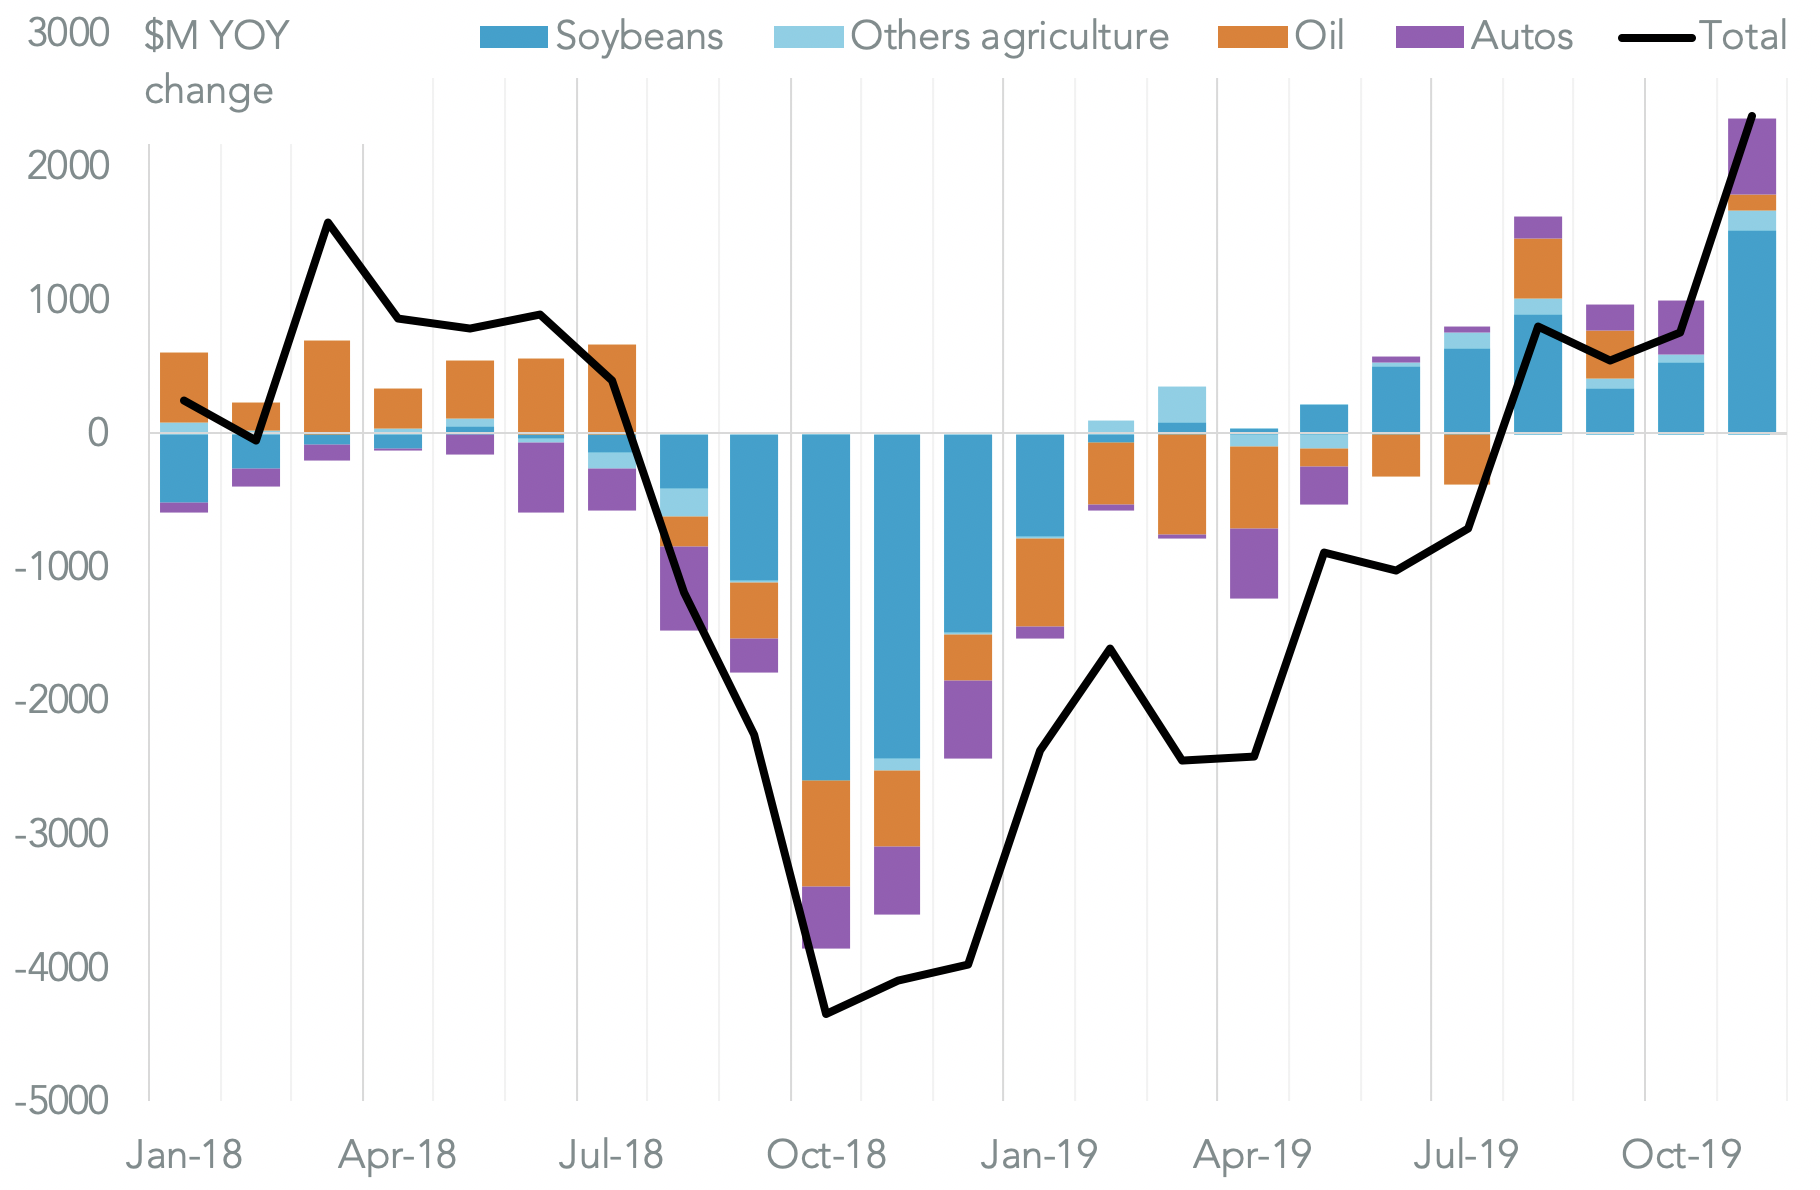
The jump in exports to China was only the second improvement since Jul. 2018. There’s the prospect of further improvements if China rolls out its phase 1 purchase commitments. Yet, it’s worth noting the improvement, worth $1.50 billion year over year, has been centered on products where China applied tariffs in July and August 2018.
The biggest contributor to the increase has been exports of soybeans which climbed to $1.53 billion in November from zero a year earlier. Exports of other agricultural products climbed 108%, or by $342m over the same period.
Outside of agriculture there was an increase in oil exports to $111 million from zero a year earlier. Among industrial products exports of cars surged 120% higher, equivalent to $577 million. There are risks to the latter, however, given exports by Tesla will drop following the opening of the firm’s Shanghai factory – EV’s represented 30.0% of total shipments in November.
Source: Panjiva