Es
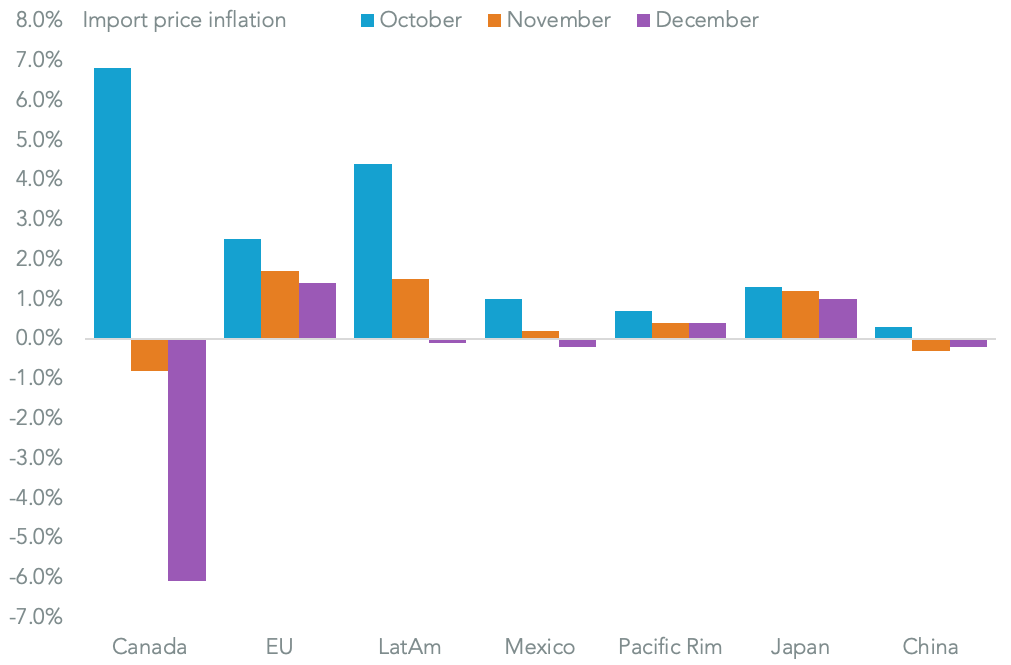
EsU.S. trade price inflation slowed once more in December, with import prices tipped into deflation in December for the first time since Oct. 2016 on a year over year basis, Panjiva analysis of official data shows. That was largely down to fuel prices though excluding food and fuel import prices still only increased 0.6%, the third month they were under 1% point. On the same basis export prices rose 1.2%.
Source: Panjiva
The slide in import prices in recent months has been due in part to lower prices on imports from China, a reaction to tariffs that were imported under the section 301 review of Chinese IP practices. Price inflation for imports from China fell 0.2% on a year earlier following a 0.3% decline the prior month suggesting exporters to the U.S. have cut prices to partly offset higher tariffs for customers. That’s consistent with corporate commentary on price cuts, as outlined in Panjiva research of Jan. 10.
Source: Panjiva
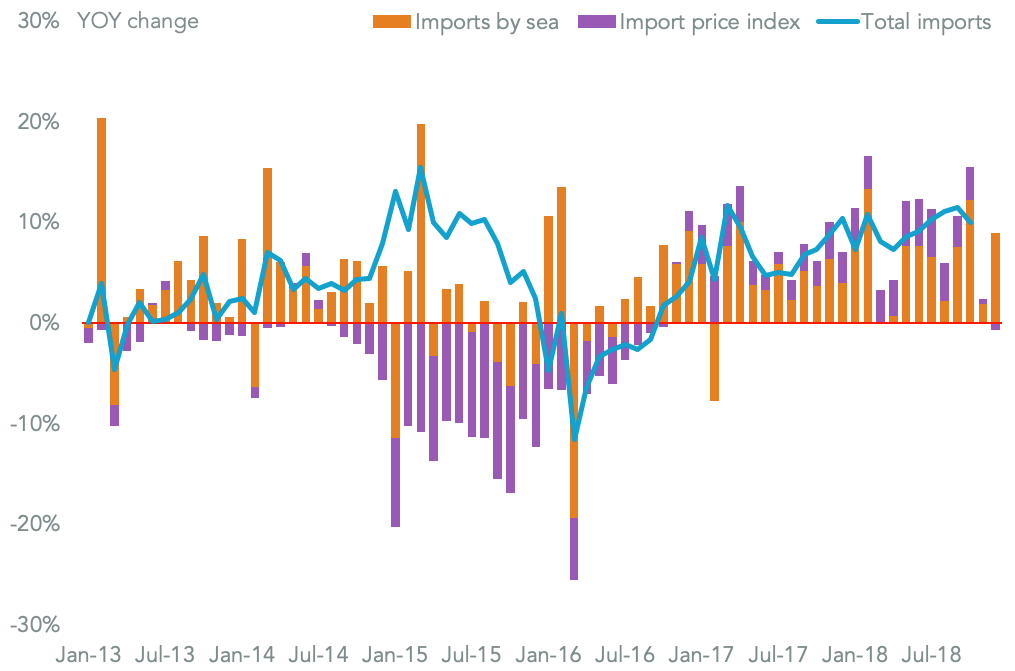
In the absence of formal trade balance data from the U.S. government relating to the shutdown, a combination of trade price inflation and seaborne shipping data can provide a guide to the underlying performance of imports. Panjiva data for U.S. seaborne shipments showed a 9.0% surge in shipments in December compared to a year earlier, driven in part by shipments from China as well as South Korea and India. So, while import price deflation will act as a drag it’s likely that U.S. imports broadly – though not necessarily from China – likely rose once again in December.
Source: Panjiva