 Es
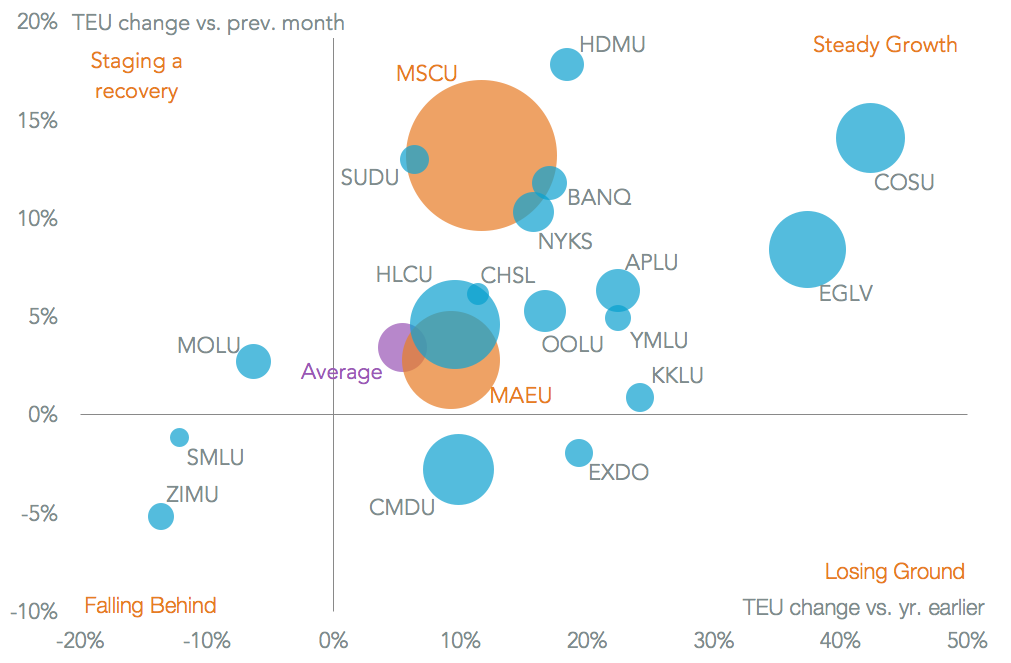
EsContainer-liners operating on U.S.-bound routes had a bumper month in March after volumes increased 7.5% on a year earlier on stronger shipments from Asia, as outlined in Panjiva research of April 6. The top 20 shippers all experienced growth, Panjiva data shows, with the exception of Mitsui-OSK, ZIM and Seaboard. The 2.8% fall seen by CMA-CGM in March compared to February likely reflects vessel reassignment within the broader group as APL expanded 6.3%.
The most notable growth came from Evergreen’s 37.4% expansion – that follows a 2% miss vs. analysts’ estimates in the fourth quarter. The rate of change across the board may also have been distorted by the April 1 commencement of operations of THE and Ocean alliances. This may have required temporary redespatching during month to have vessels in position for their new routes.
Source: Panjiva
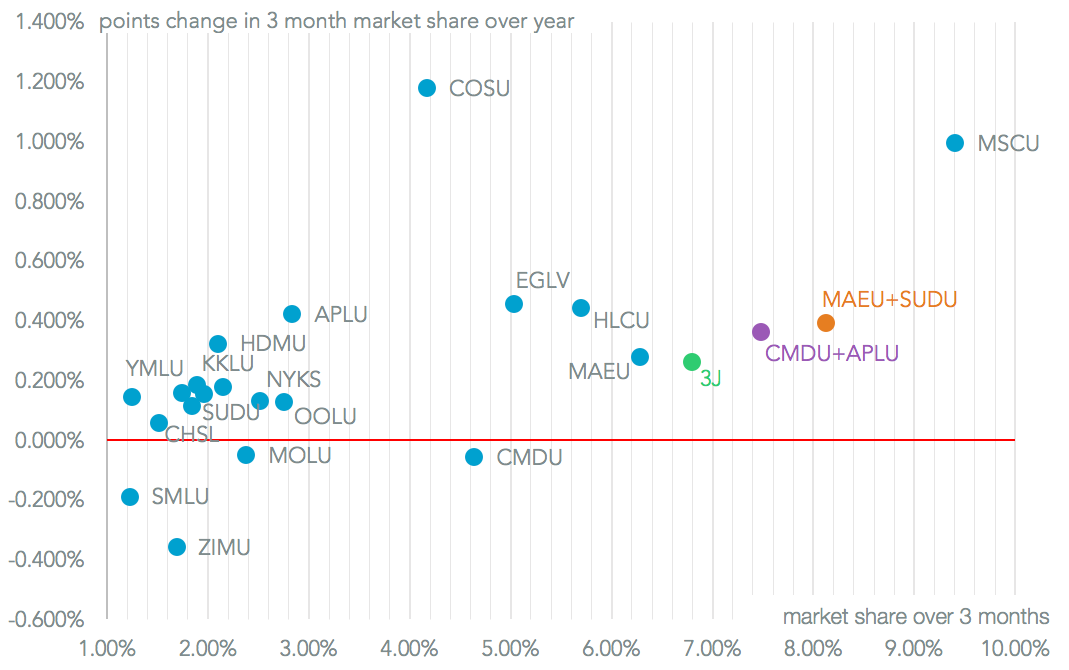
The consolidation of the sector continues in organic terms as well as a result of ongoing deals. The top 20 carriers increased their market share in the first quarter by 4.67% points on a year earlier, bringing the total to 63.1%. Aside from ZIM (which dropped to 17th from 11th) and Seaboard (20th from 19th) none of the top 20 saw a drop on a year earlier over that period in their market share.
Source: Panjiva
Some controversy remains over the degree of consolidation in the market for U.S.-bound shipping. A recent U.S. Congressional committee hearing asked whether consolidation including or excluding the alliances and whether they have an impact on prices or just operations is influencing pricing. Furthermore, the Department of Justice may be investigating the market for shopping services.
Panjiva analysis of the top 750 country-carrier pairs shows that while the three big alliances have top 10 positions in almost all routes, they are evenly matched against each other. The exception is that Ocean has a lower critical mass in intra-Americas trade than 2M or THE. They are also challenged by non-affiliated shippers and NVOCC operators too.

Source: Panjiva


