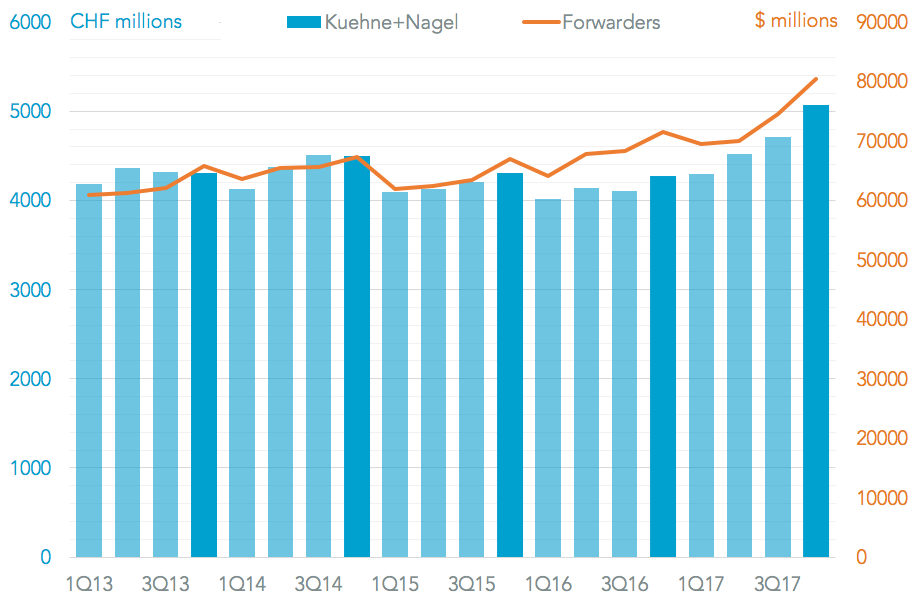
K+N Joins Peers With Great Revenues, Disappointing Profitability — Panjiva
Más

K+N Joins Peers With Great Revenues, Disappointing Profitability

Corp - Forwarders 347 Earnings 759 Global 1391 Mode - Airfreight 182 Mode - Seaborne 1845

Freight forwarder Kuehne & Nagel (K+N) reported 4Q 2017 revenues that climbed 18.5% on a year earlier, and were 5.1% better than analysts expected according to S&P Global data. In that regard it joins all the other forwarders that have reported so far, as outlined in Panjiva research of February 20, which have beaten by between 2.4% (DSV) and 7.6% (XPO).

In common with Expeditors a 31.7% increase in airfreight revenue was the largest driver of growth. A 15.4% rise in seafreight might not be continued given a 3% drop in volumes on U.S.-inbound routes in January, indeed the company expects volume growth for the market to slow to between 4% and 5% globally in 2018 though the company has seen the market “start strong”.

FLYING REVENUES BECAUSE OF FLYING FREIGHT

Chart compares revenues for freight forwarders. Total includes companies shown plus CH Robinson, K+N, Panalpina, Fedex, Deutsche Post, JB Hunt and XPO Logistics. Calculations based on company financial statements and average analysts’ forecasts gathered from S&P Global Market Intelligence on February 28 2018. Source: Panjiva

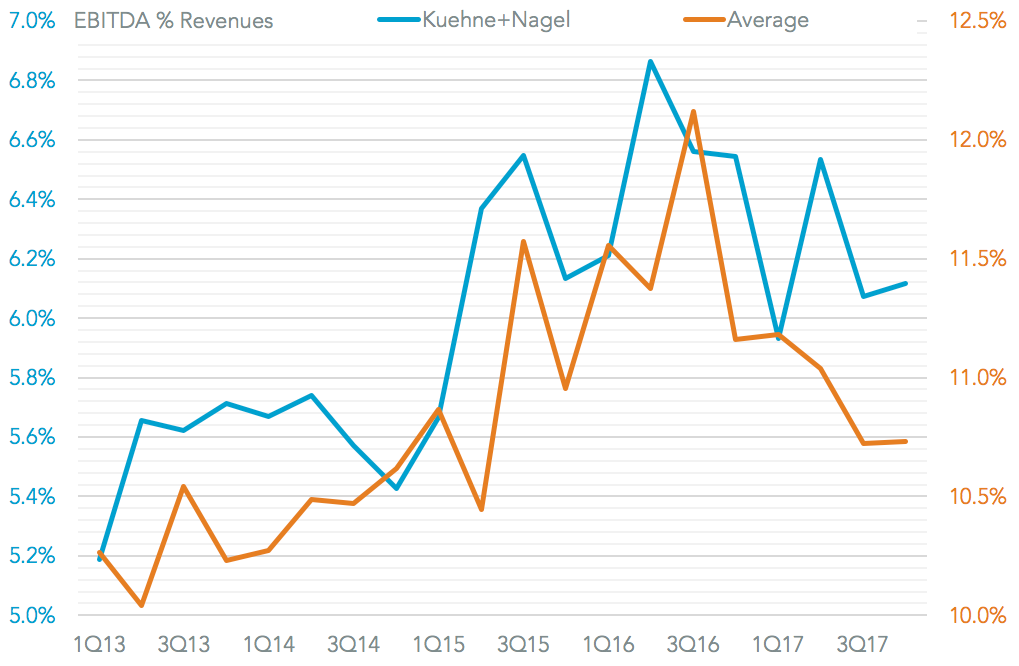
The growth in revenues came at a cost, with profitability (measured by the EBITDA margin) having fallen to 6.12% from 6.55% a year earlier. Analysts’ estimates implied a ratio of 6.26%, suggesting a slip in pricing discipline – a key concern discussed in our 2018 Outlook – even though the absolute level of profits was 2.6% better than expected. 

THE COST OF COMPETING

Chart compares EBITDA margin (earnings before interest, tax, depreciation and amortization) for freight forwarders. Total includes companies shown plus CH Robinson, K+N, Panalpina, Fedex, Deutsche Post, JB Hunt and XPO Logistics. Calculations based on company financial statements and average analysts’ forecasts gathered from S&P Global Market Intelligence on February 28 2018. Source: Panjiva

That’s a sector-wide issue with six of the eight forwarders having delivered margins below expectations, with six of the eight to report so far (Fedex and XPO being the outliers) having seen a drop in margins vs. a  year earlier.

FORWARDERS’ SCORE CARD – MUST TRY HARDER

Chart compares EBITDA margin (earnings before interest, tax, depreciation and amortization) for selected freight forwarders. Calculations based on company financial statements and average analysts’ forecasts gathered from S&P Global Market Intelligence on February 28 2018. Source: Panjiva

Copyright © 2025 Panjiva Supply Chain Intelligence, a product offering from S&P Global Market Intelligence Inc. All rights reserved.