 Es
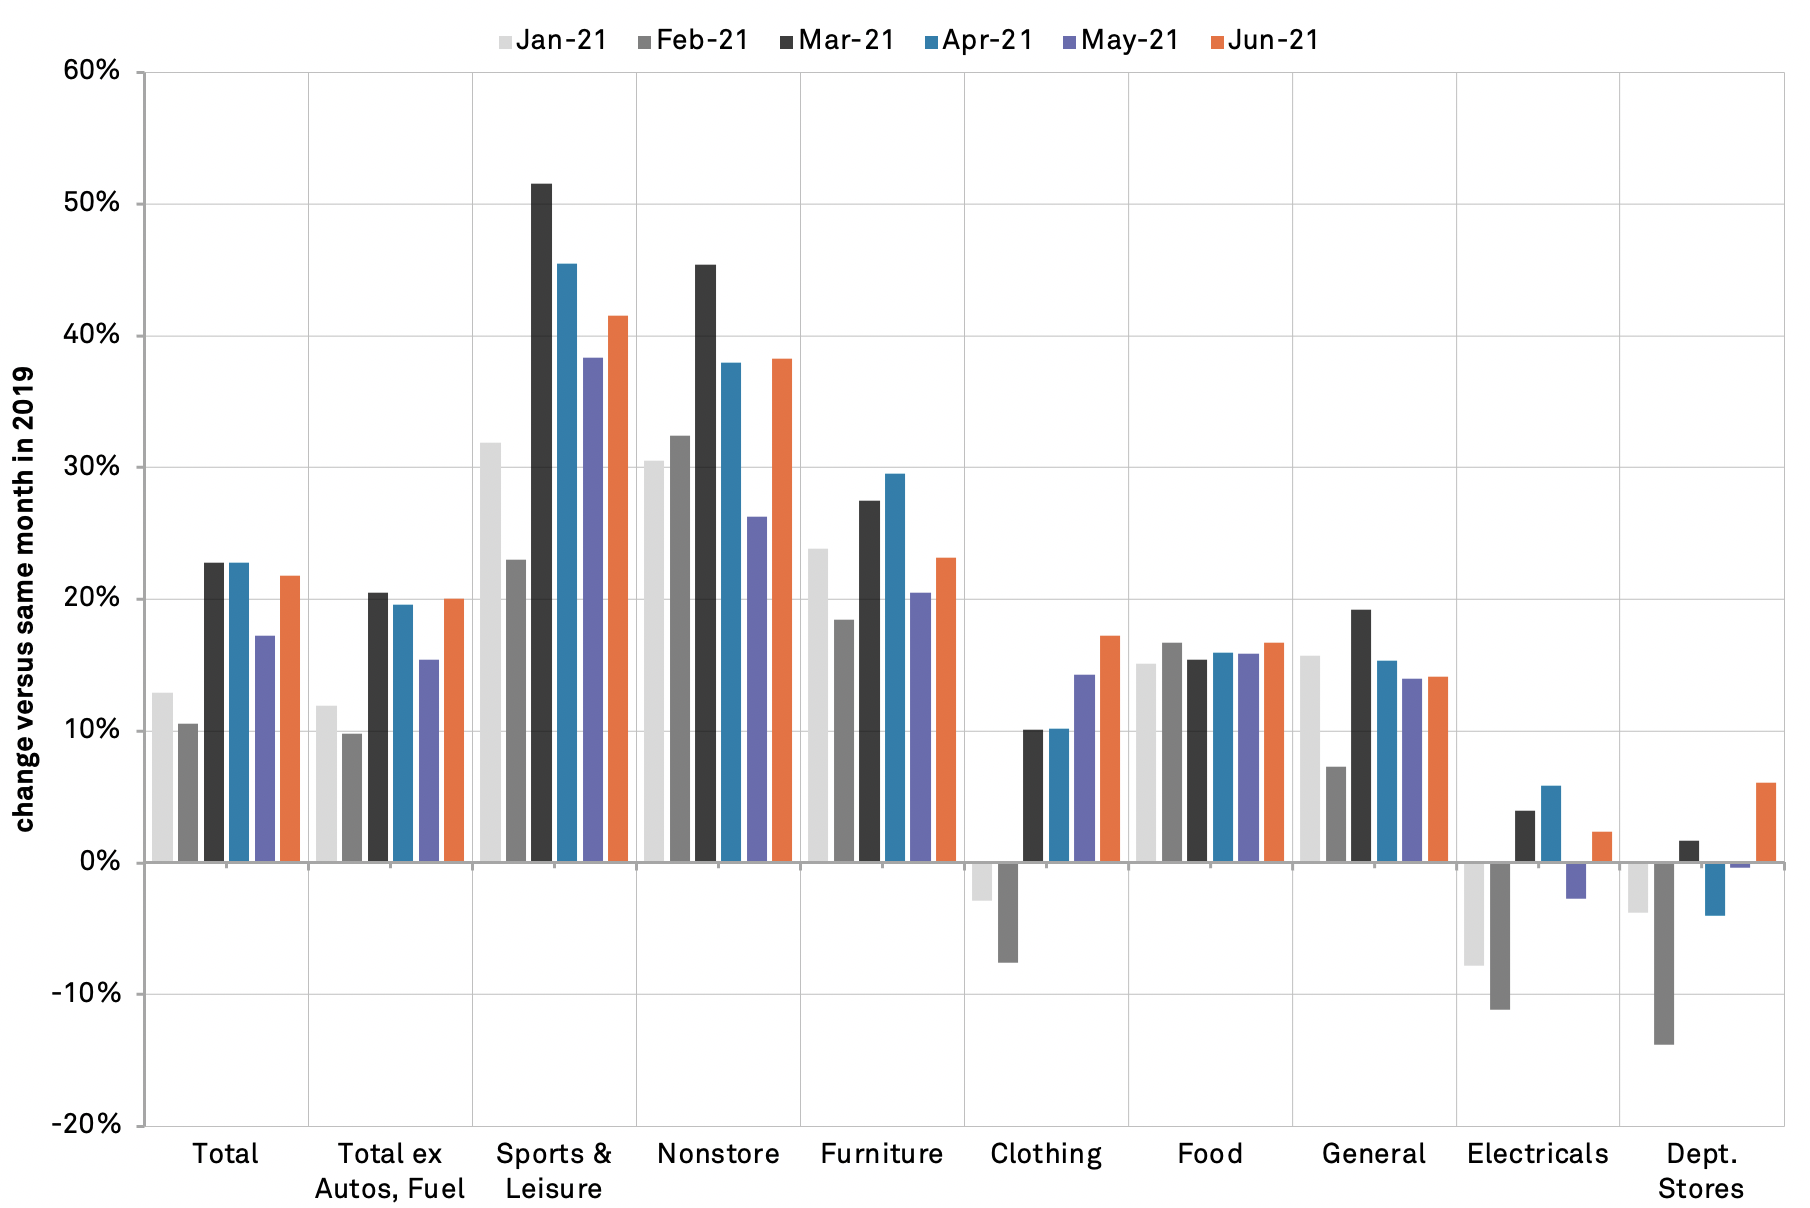
EsThe recovery in U.S. retail sales remained robust in June as total sales climbed by 18.5% year over year while sales excluding autos and fuel rose by 16.1%, Panjiva’s analysis of official data shows. Both were slower than a month earlier though distortions from the pandemic a year earlier still apply. Sales excluding autos and fuel climbed 20.0% in June 2021 versus June 2019. Inflation may be playing a part, as discussed in Panjiva’s research of July 15.
The fastest rate of growth came in sports and leisure goods which climbed 41.5% on the back of increased spending on outdoor leisure. Nonstore (e-commerce) sales expanded by 38.3% in June, up from 38.3% in May while all store types excluding electricals (up by 2.3%) and department stores (up by 6.1%) grew at a double-digit rate.
Source: Panjiva
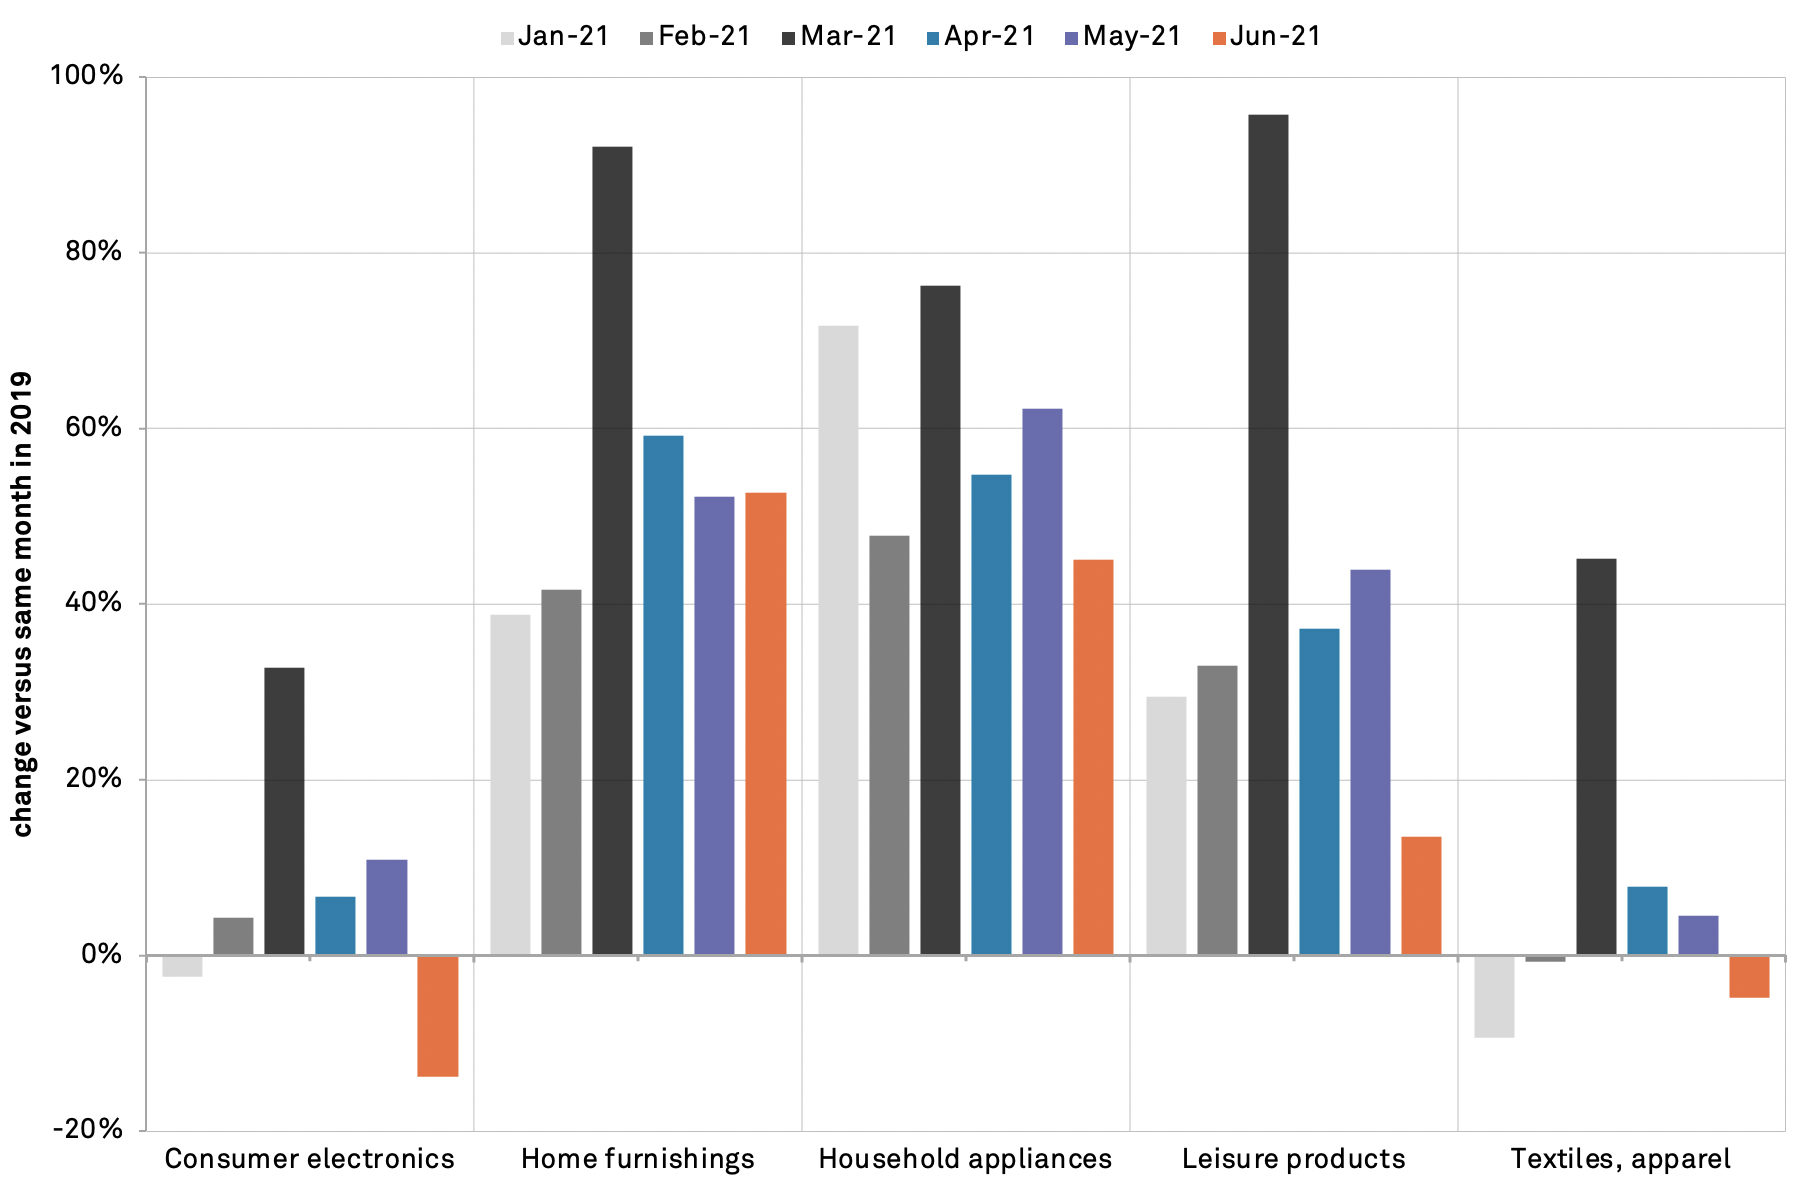
Electronics retailers have already reacted to the slowdown in sales. Panjiva’s data shows that U.S. seaborne imports of consumer electronics fell by 13.8% in June 2021 versus June 2019.
Notably apparel imports fell by 4.9% while sales by clothing stores increased by 17.2%, raising the prospect of shortages during the ongoing back-to-school shopping season.
Similarly, imports of leisure products, ranging from toys to sports equipment, only increased by 13.6% after surging 43.9% a month earlier suggesting inventory management may already be underway in the sport and leisure segment.
As in prior months imports of home furnishings and household appliances were up by 52.7% and 45.1% respectively, potentially indicating a build up of inventories well ahead of the usual peak sales season.
Source: Panjiva


