 Es
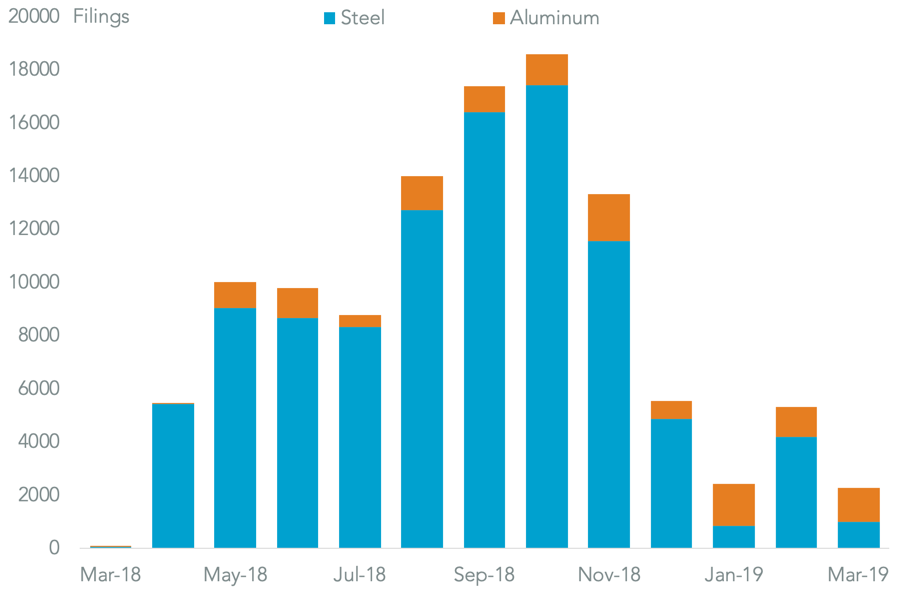
EsNearly one year on from the initial imposition of section 232 duties on steel and aluminum there are still new applications being made for exclusions from U.S. importers. Panjiva analysis* of government filings for steel and aluminum shows 112,802 filings were made as of Mar. 8, 89% of which relate to the 25% duties on steel imports.
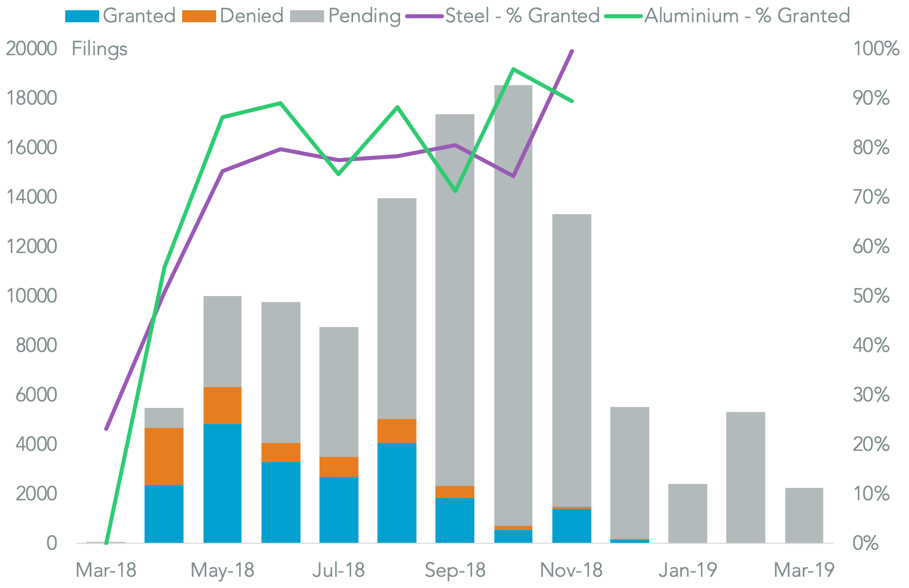
The process of gaining approvals is slow, however, with 74.8% of all cases still pending, including some outstanding from as early as March 2018. For context in the past 15 working days since the prior analysis was carried out a total of 2,957 decisions were processed – at that rate it will take around 20 months to clear the backlog.
Source: Panjiva
The wait is worthwhile, however, with 72.7% of all decisions in steel being granted and 86.5% in aluminium. An added layer of uncertainty comes for importers from Canada, Mexico and the European Union.
As discussed in Panjiva research of Feb. 25 the Canadian and Mexican governments have made it clear they want the tariffs to be removed before the U.S.-Canada-Mexico Agreement can be ratified. Similarly European Union officials have stated that they want the tariffs removed as a precursor to negotiations on a wider trade deal.
Source: Panjiva
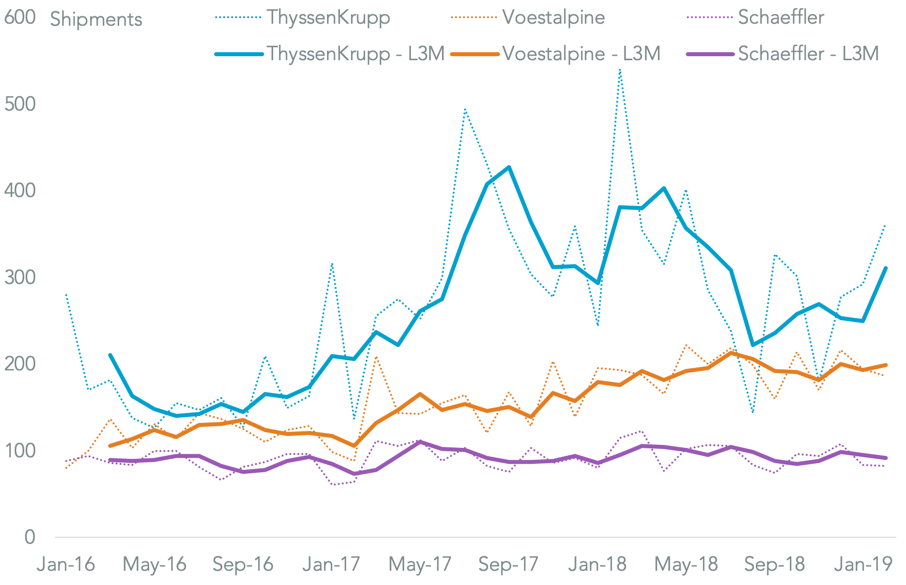
Tariff leniency hasn’t resulted in continued import growth though. U.S. seaborne imports of all steel and aluminium products dropped 2.4% year over year in the first two months of 2019 after falling rising 8.6% in 4Q, Panjiva data shows. Most of the major steel suppliers have seen a similar pattern including ThyssenKrupp, down 16.3% in the first two months of the year, Schaeffler (14.4% lower) and Voestalpine (down 2.1%).
Source: Panjiva
* Data available on request from support@panjiva.com


