 Es
EsPanjiva Research will take part in a webinar with our colleagues from S&P Global Market Intelligence’s energy research group to discuss the prospects for U.S. solar power development. This report provides an overview of solar power equipment supplies to the U.S. over the past 10 years while registration for the event can be found here.
U.S. renewable energy supply chains have faced significant upheaval in the past 10 years. There was significant support for investment in solar power during the Obama administration, reaching a crescendo with an 88.1% year over year jump in imports in 2011 compared to 2010, Panjiva’s data shows.
That was largely driven by a surge in shipments from China which led to antidumping tariffs being applied in July 2012. In turn that led to a shift in manufacturing to other countries, in particularly South Korea and Malaysia.
Continued support for renewables via tax credits led to a renewed surge in imports in 2016 with an 84.4% year over year jump in imports to reach a peak of $8.31 billion ahead of the projected end of tax credit availability and concerns about the Trump administration’s energy policies. Along the way there were also antidumping tariffs applied against imports from Taiwan and China in February 2015.
The Trump administration’s tariff led trade policy inevitably led to the application of section 201 “safeguarding” duties to protect U.S. domestic manufacturers, discussed in Panjiva’s research of Feb. 24. The application of tariffs and quotas in January 2018 meant imports hit a trough of $2.64 billions 2018, or 68.2% below their peak.

Source: Panjiva
More recently though there has been a surge in imports. The increase started in 2019 ahead of the end of tax credits which have since been extended. While the latter should protect the economics of many projects, there are still around 140,000MW of projects that do not yet have a power sales agreement attached, according to S&P Global Market Intelligence research.
Panjiva’s U.S. seaborne shipping data shows imports climbed by 65.9% year over year in Q2, while total imports in the 12 months to May 31 reached $7.96 billion, or just 4.2% below their peak levels. That’s partly been helped by a more lenient tariff treatment for bifacial panels being left in place.
Yet, the uplift in sourcing has raised concerns regarding over-supply, particularly in light of the COVID-19 linked installation slowdown. That may lead to a need for industry consolidation according to Canadian Solar.
The Q2 surge in shipments has been widespread with imports from South Korea having climbed by 76.8% year over year while those from China improved by 71.5%. The leader though has been Vietnam with shipments that surged 132.2% higher in Q2. The expansion was led by a 50.9% rise in shipments associated with East Group while First Solar took delivery of shipments in January through May. The outlier was Boviet Solar, owned by Ningbo Boway Alloy, which fell by 21.1%.
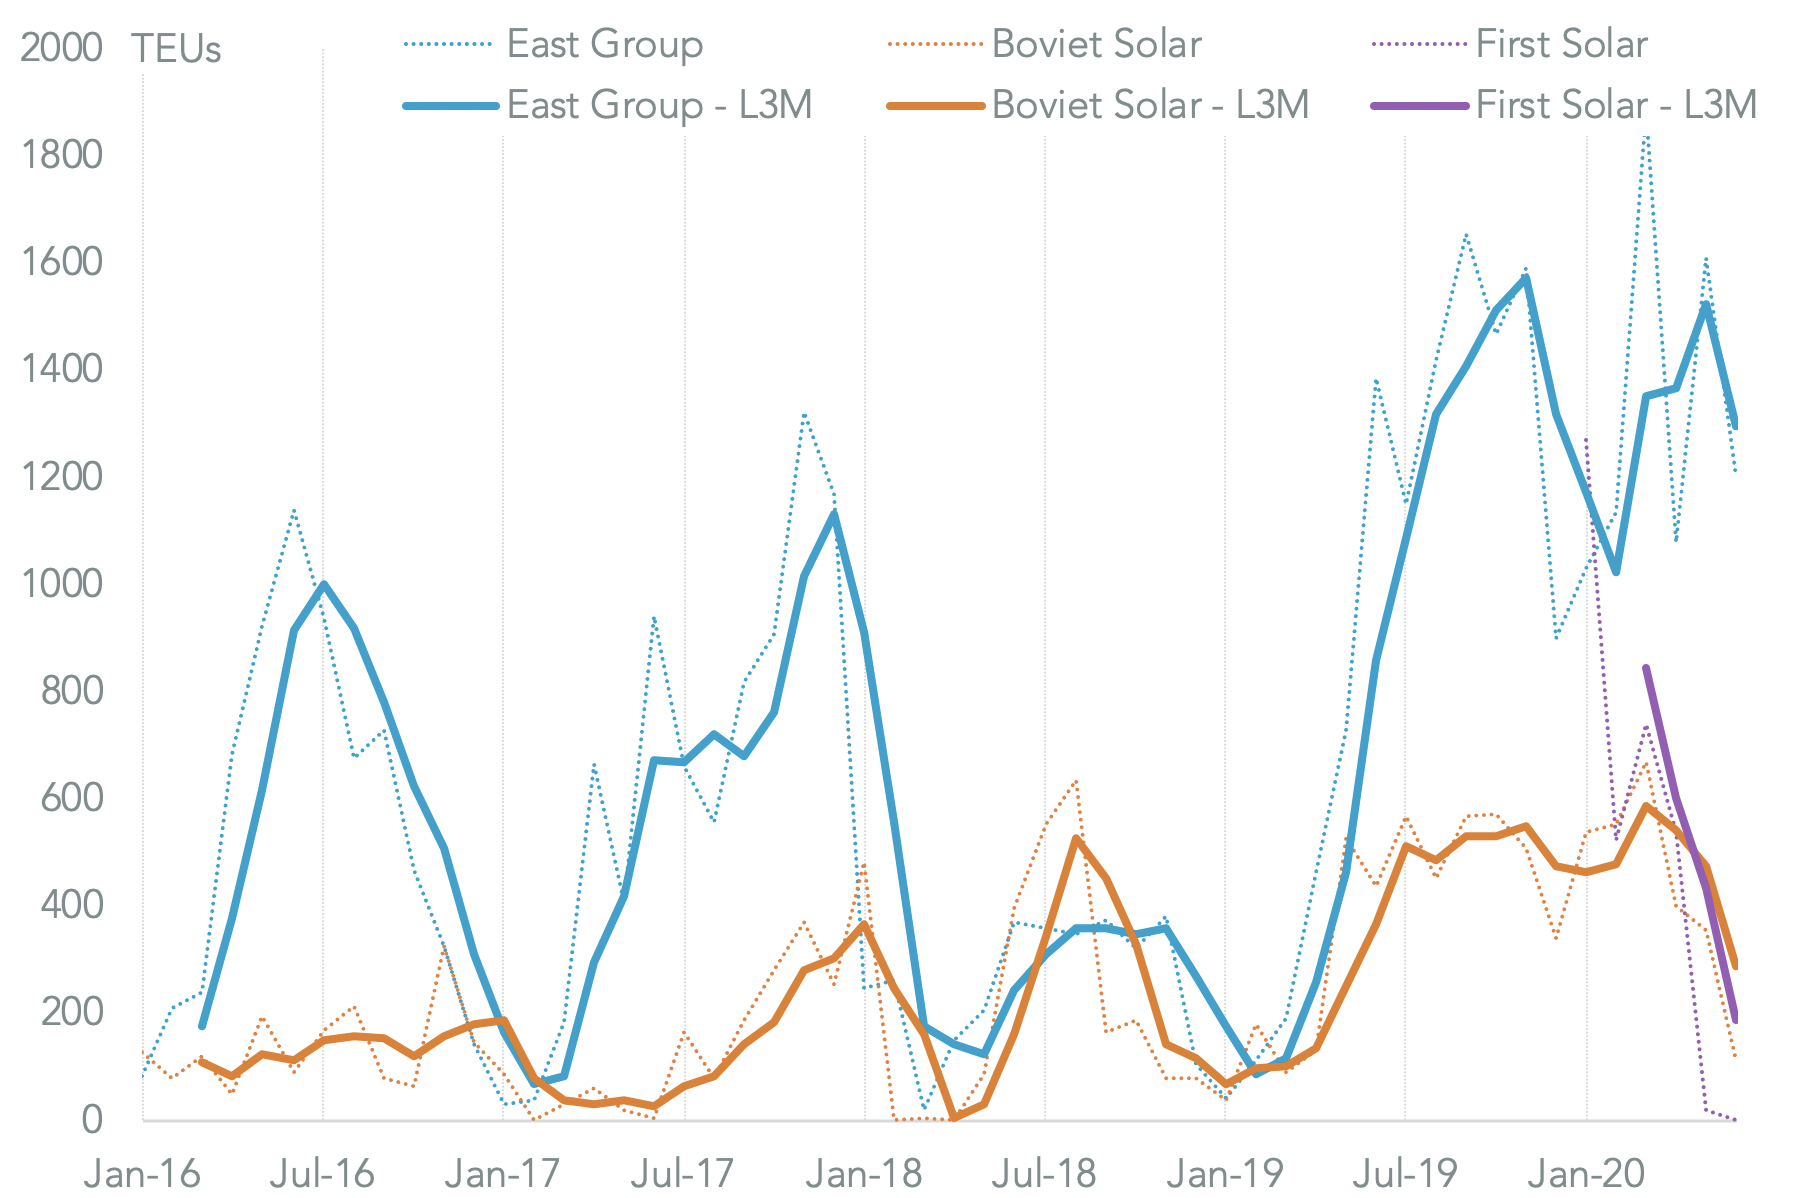
Source: Panjiva
The shift in supply chains has happened within companies as well as across regions. Many firms have shifted their production location in response to tariffs, manufacturing costs and technology. Hanwha Q Cells is one example of a firm that has drawn on varying sourcing strategies.
The share of U.S. seaborne imports from South Korea rose from 43.1% in 2016 to 89.5% in 2018 before declining to 67.9% in H1’20. That came at the expense of Hanwha’s Malaysian facilities which fell to 10.4% of U.S. shipments in 2018 from 44.5% before recovering to 25.1%. Imports from China linked to the firm have been sporadic and minimal, perhaps unsurprisingly given the shifting tariff landscape over the past five years.
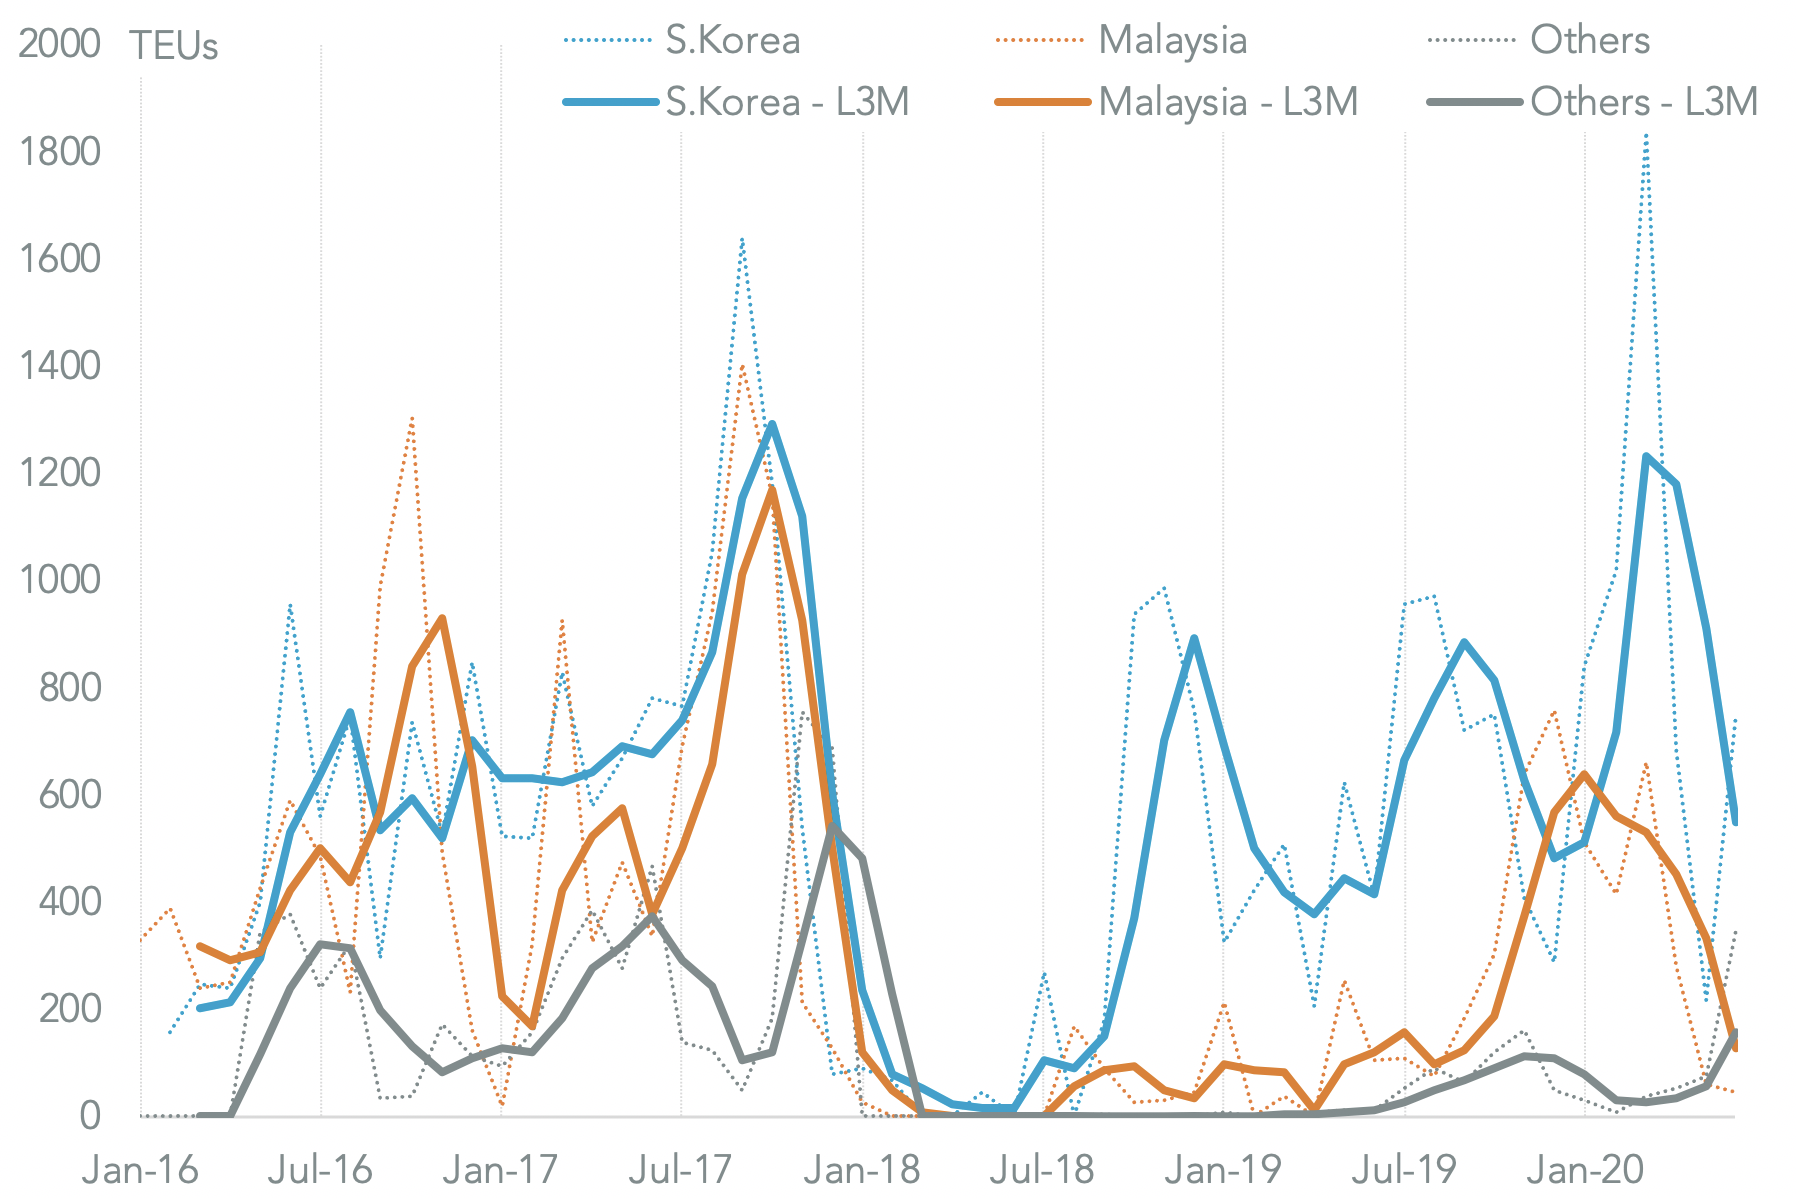
Source: Panjiva


