Es
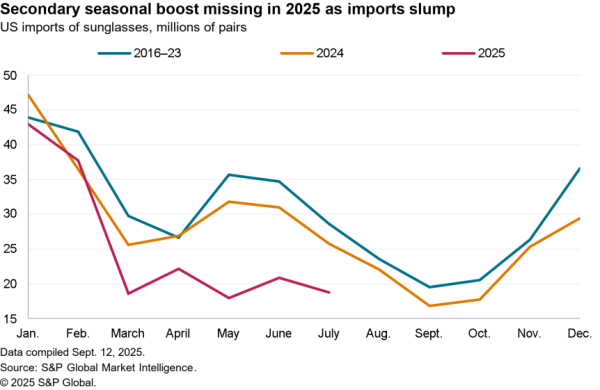
EsU.S. international trade activity fell by 1.7% year over year in January, Panjiva’s analysis of official data shows, marking a 17th straight monthly decline in goods and services combined. That was nonetheless the slowest rate of decline since Dec. 2019 resulting from an accelerating surge in imports of goods which climbed 8.5% higher as a result of strong consumer demand, as discussed in Panjiva’s Feb. 6 research.
Services activity remained weak, down by 19.8% across exports and imports, due to the effects of the pandemic. Exports of goods were still in reverse despite increased purchases of American goods by China under the phase 1 trade deal. On a customs basis total exports of goods dipped 1.1% lower in January, while excluding those from China the drop was 5.8%, Panjiva’s data shows.

Source: Panjiva
U.S. Commerce Secretary Gina Raimondo has stated that Trump administration tariffs, including those steel and aluminum section 232 duties have been “effective” and that there will be a root-and-branch review to “decide what it makes sense to maintain“, CNBC reports.
The moderated approach is consistent with the administration’s established stance, for example the 100 day review of critical supply chains, and will require an extensive review of the tactics used with regards to China.
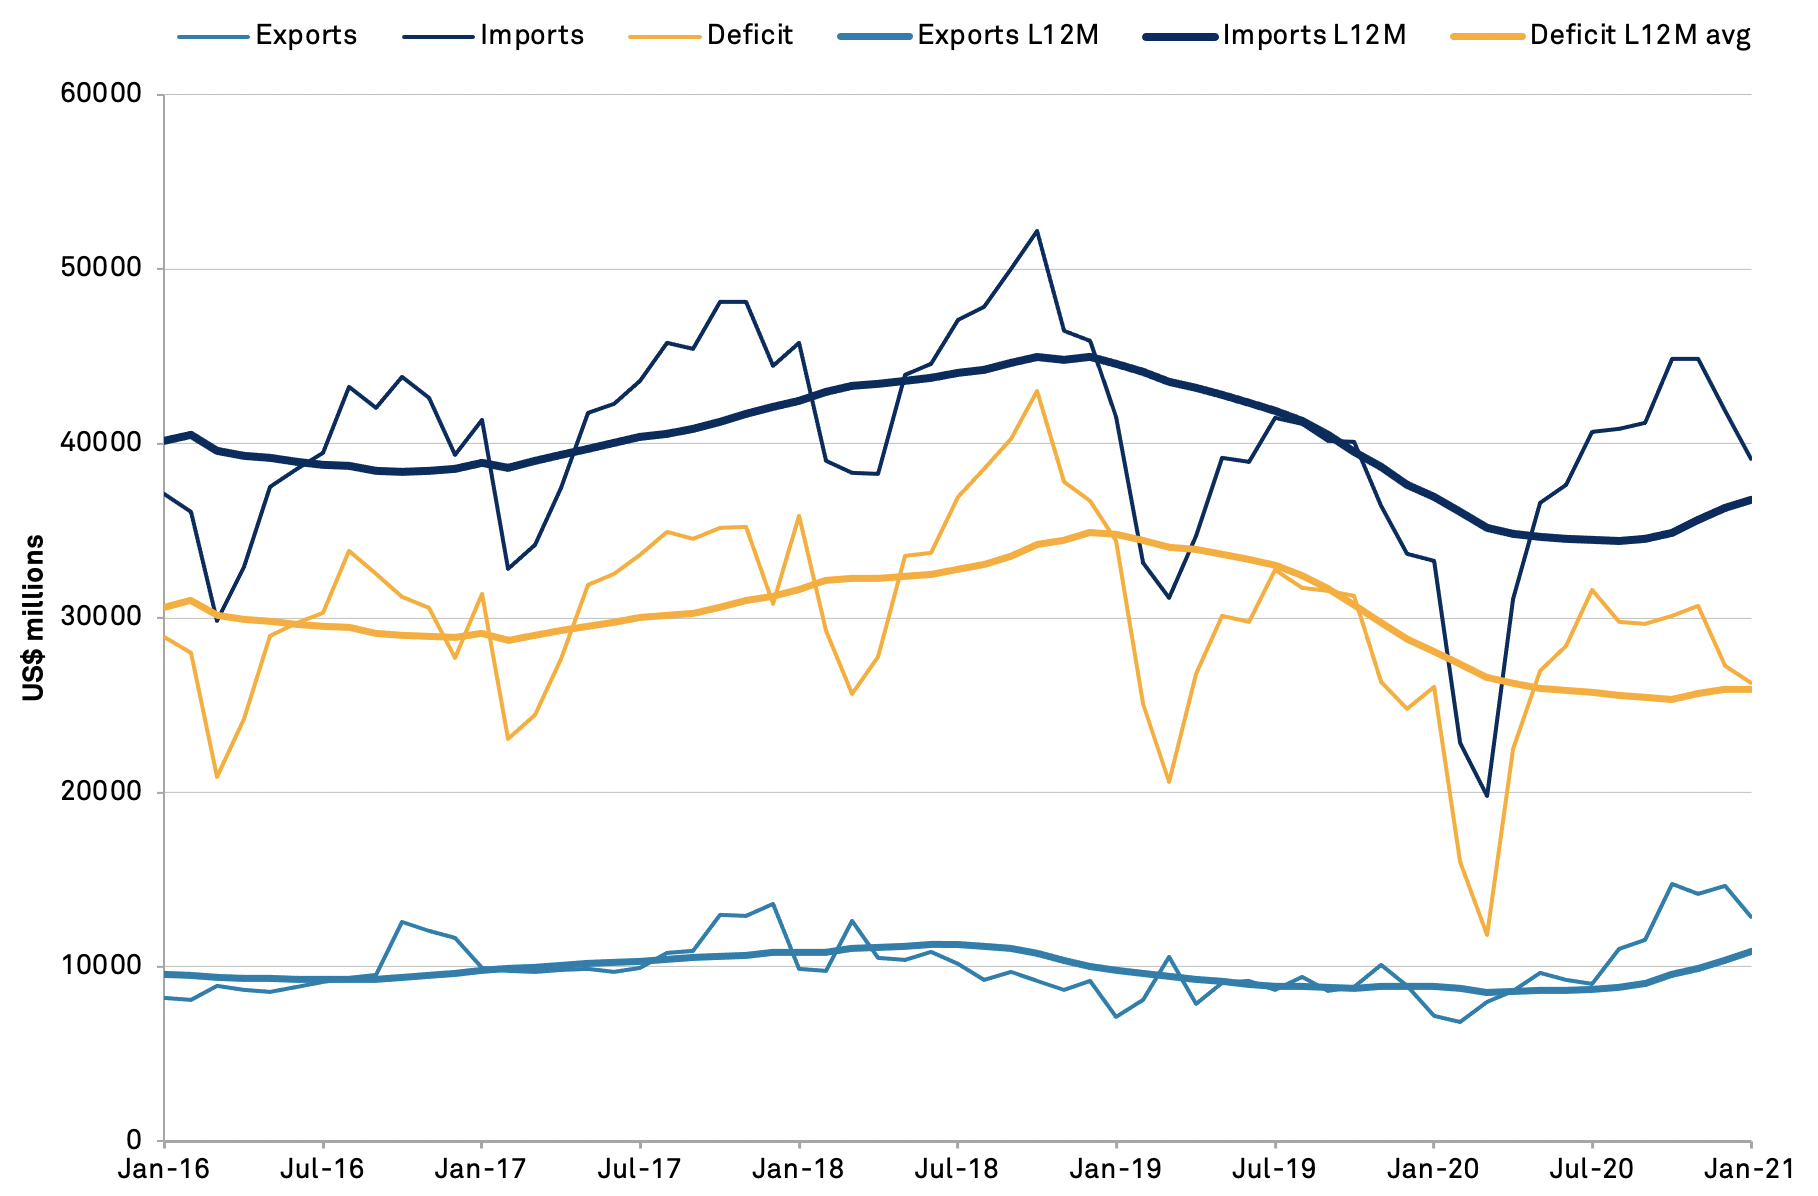
Total U.S. trade with China has continued to expand, with exports climbing 78.2% higher year over year in January. That includes a 102.4% rise in exports of phase 1 trade deal products and a 28.3% rise in non-phase 1 products. Yet, that came alongside imports that rose by 17.5% with the result that the trade deficit of $26.5 billion was actually 0.7% higher than a year earlier.
Source: Panjiva
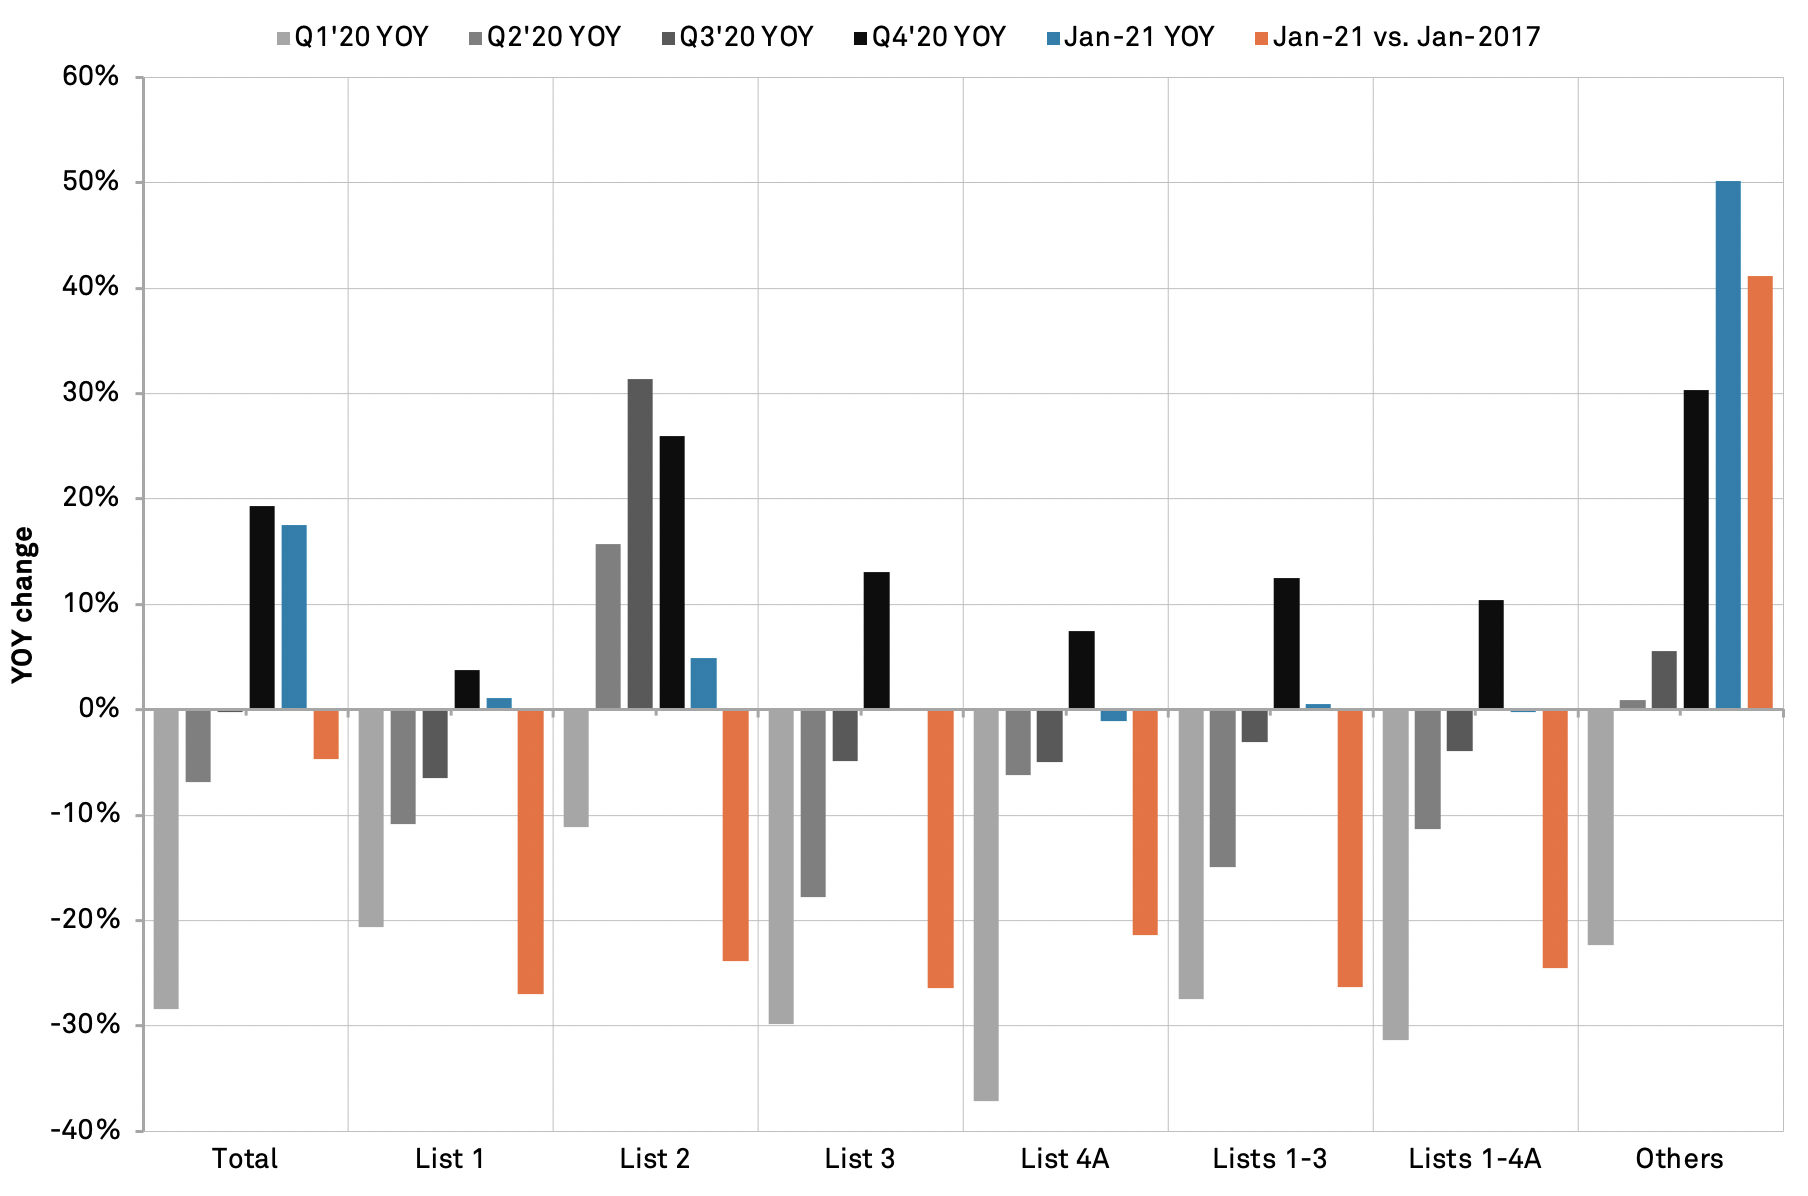
The increase in imports and the resulting goods deficit with China reflects the maturity of the tariffs on imports from China. Panjiva’s analysis shows that imports of products covered by lists 1, 2 and 3 where tariffs were applied at a 25% rate in waves from July 2018 inched 0.5% higher year over year in January. That included a 4.9% increase in list 2 products, many of which have received exemptions including those of medical supplies which will lose their exemption from March.
More broadly though imports in January of products covered by the four tariff lists fell by 24.5% compared to January 2017. That would confirm Secretary Raimondo’s assertion that the tariffs have worked, at least in their target of cutting imports from China on a sustained basis.
Source: Panjiva