Es
EsThird-party logistics operator (3PL) UPS reported third quarter revenues that expanded by 9.2% on a year earlier. That was driven by a 16.6% surge in forwarding revenues and 11.4% in freight handling in the supply chain business. The traditional packages business meanwhile saw a more modest 2.7% growth in volumes but was helped by a 4.0% rise in average revenues per parcel.

Source: Panjiva
EBITDA margin of 13.5% was well below the 14.3% expected by analysts surveyed by S&P Global Market Intelligence. That was likely due in large part to a 1.4% point drop in profit margins in the international business due to “unforeseen currency and fuel headwinds”.
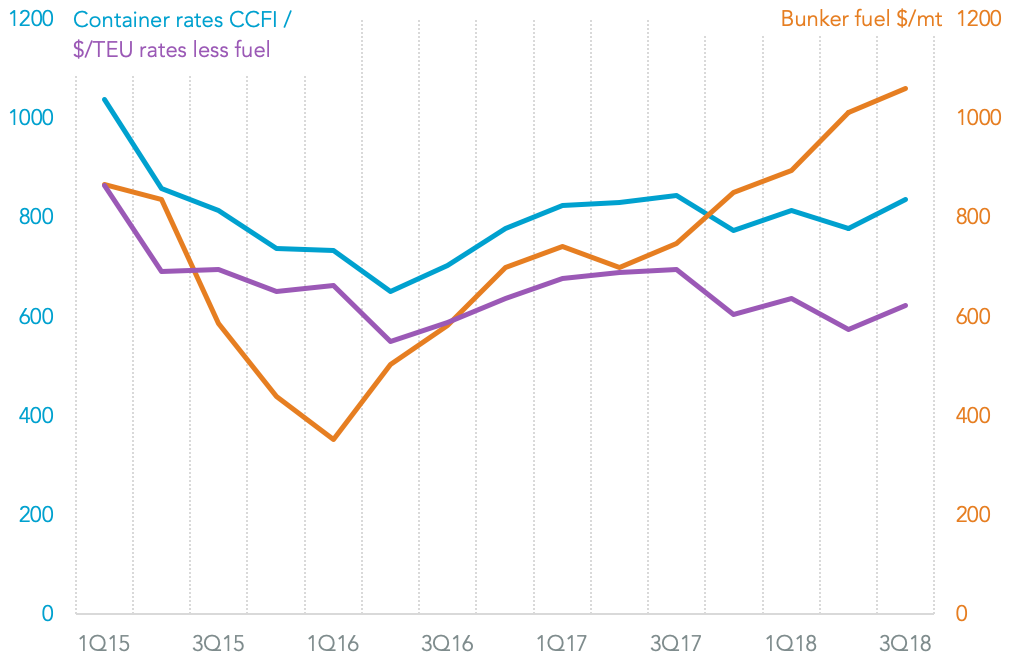
The rising fuel costs can be seen in a 43.1% rise in average bunker fuel costs for marine shipping in the third quarter vs. a year earlier and by 5.7% vs. the second quarter, S&P Global Platts data shows. In turn that has also caused a headache for container-lines as outlined in Panjiva research of October which led to a series of bunker-fuel surcharges and a 7.5% rise in container rates in the third quarter vs. the second quarter.
Source: Panjiva
The increase in costs left the EBITDA margin below the 16.3% level seen a year earlier and at its lowest since at least 2013. That’s consistent with the pattern seen by both Fedex and K+N. It supports UPS’s push for a new round of efficiency improvements and technology investments.

Source: Panjiva
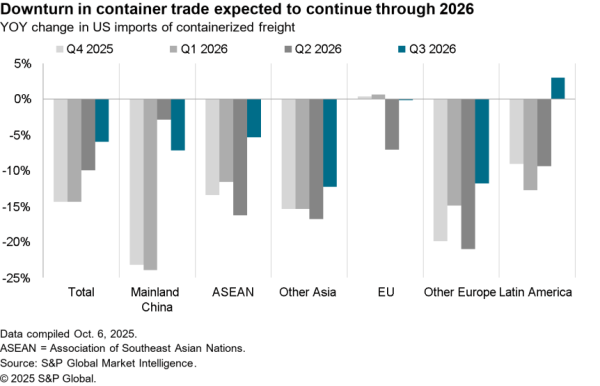
That bigger challenge will come from the expansion of tariffs on bilateral trade worth $360 billion between the U.S. and China. These were implemented fully on September 24 with rates set to be increased from January.
UPS had already seen a decline in its share of U.S.-inbound seaborne shipments, Panjiva data shows, after a 9.3% drop vs. a 4.0% increase for the industry as a whole in the third quarter. With 60.9% of UPS’s U.S.-inbound seaborne traffic having originated in China in the third quarter the risks from tariff-led competition are particularly high.

Source: Panjiva
*Forwarders included in aggregates include: Ceva Logistics, CH Robinson, DSV, Expeditors International, K+N, Nippon Express, Palapina, UPS, Fedex, Deutche Post, JB Hunt and XPO Logistics.