Más

Msc Meditterranean Shipping Company Sa

Shipping Company Profile | SCAC: MEDU

Shipments Processed

  • 12,138,250
    Shipments Processed (U.S. Imports)

Shipments by Month

TEUs by Month

Subscribe today to get full access.

Suppliers

371,114 Suppliers shipping with MEDU

Buyers

343,492 Buyers shipping with MEDU

Vessels

17,044 Vessels used by MEDU

Foreign Ports

504 Foreign Ports used by MEDU

Top MEDU Foreign Ports

  1. Yantian
  2. Shanghai
  3. Busan

U.S. Ports

95 U.S. Ports used by MEDU

Top MEDU U.S. Ports

  1. New York Newark Area
  2. Port of Long Beach
  3. The Port of Los Angeles

Shipment Statistics for Msc Meditterranean Shipping Company Sa

  • 12,138,250
    Total shipments
  • 32,535,928 TEUs
    Total volume
  • 2.68 TEUs
    Average shipment size

Shipments by month

Shipment Market Share (%)

Subscribe today to get full access.

TEUs by month

Subscribe today to get full access.

TEU Market Share (%)

Subscribe today to get full access.

Recent Panjiva Research about Msc Meditterranean Shipping Company Sa

20220316-ports-of-lading

Hyundai, digital forwarders top February

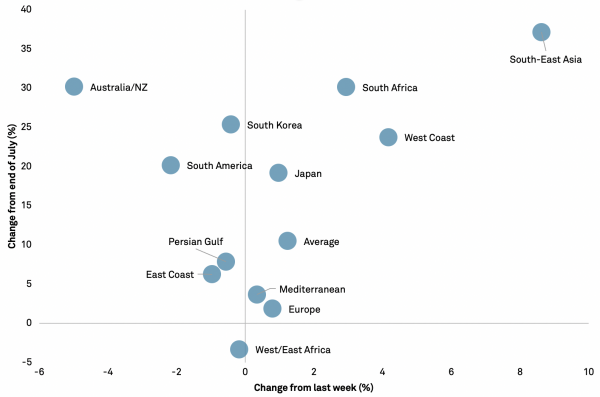
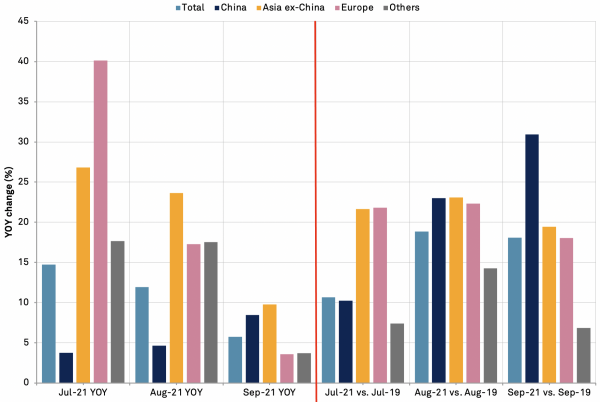
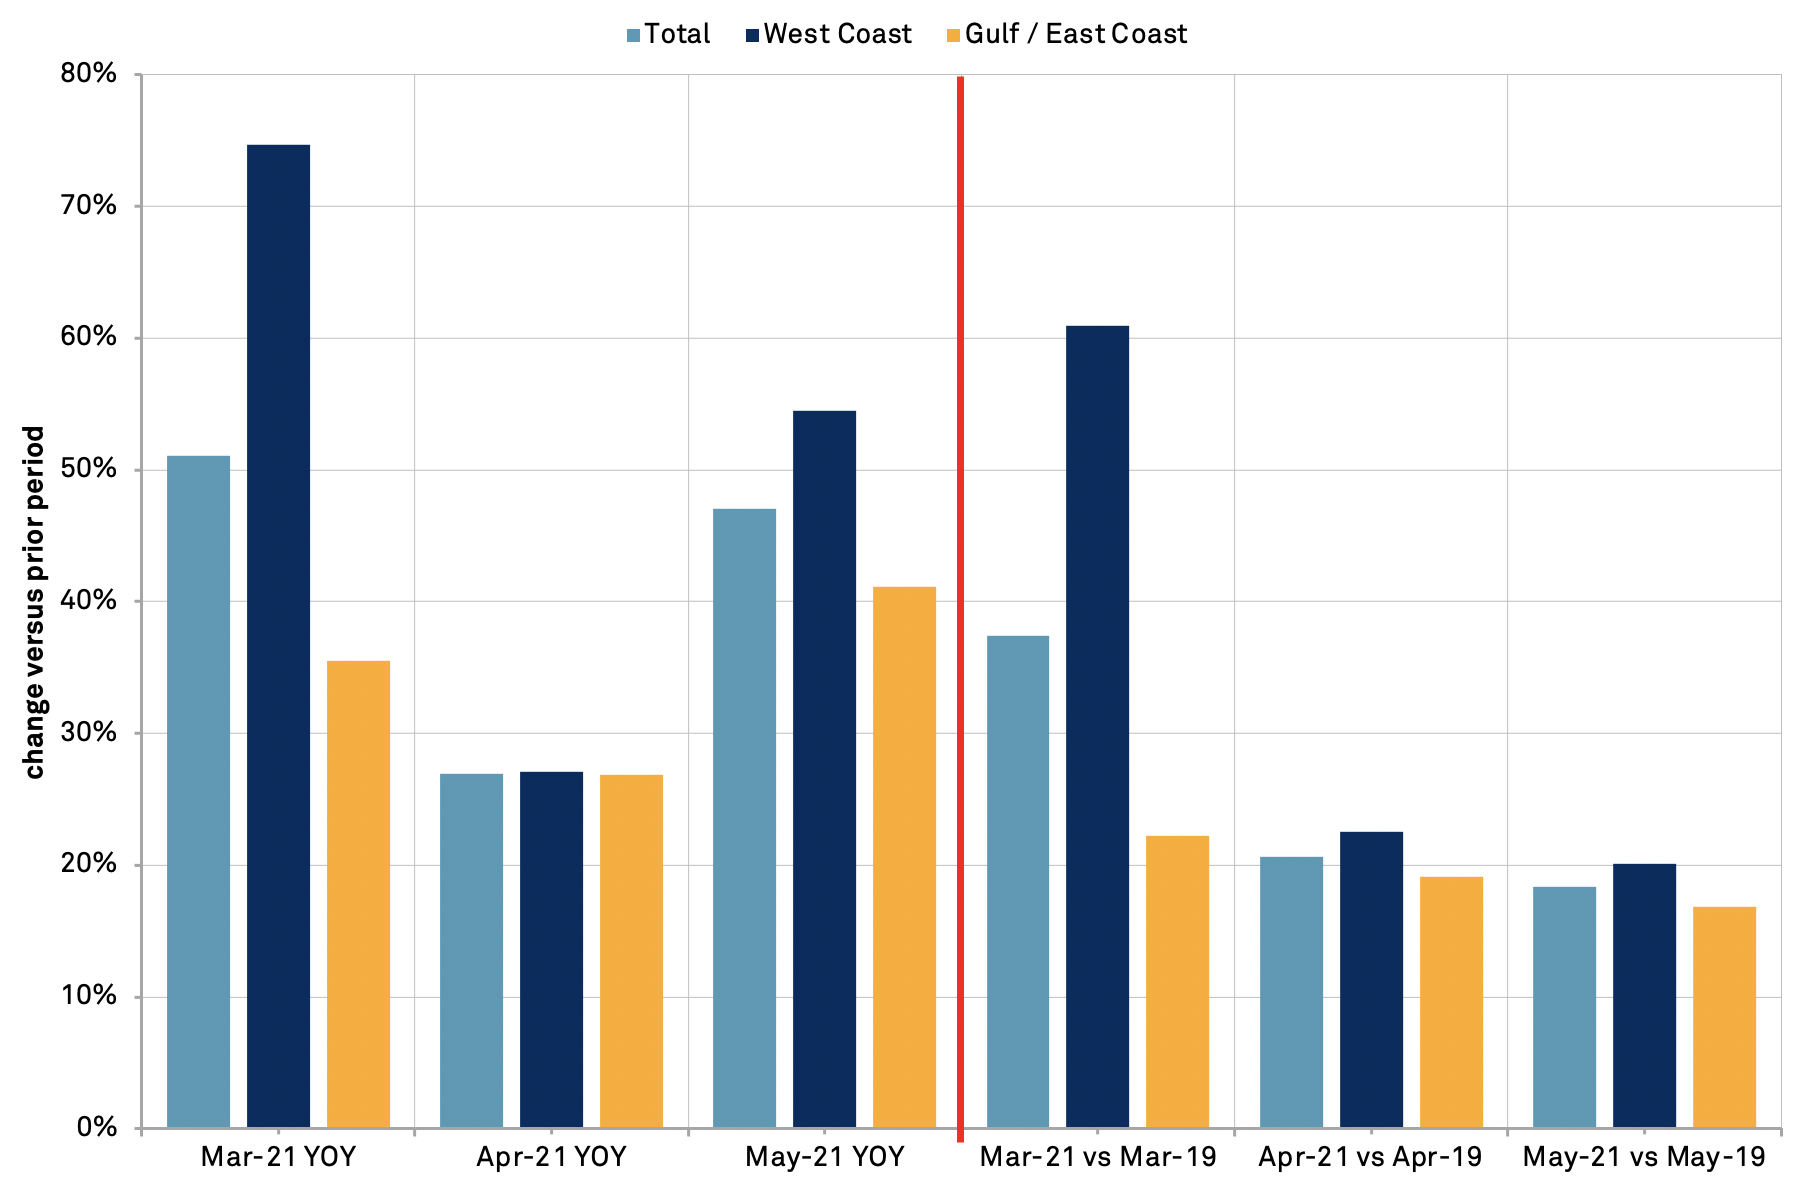
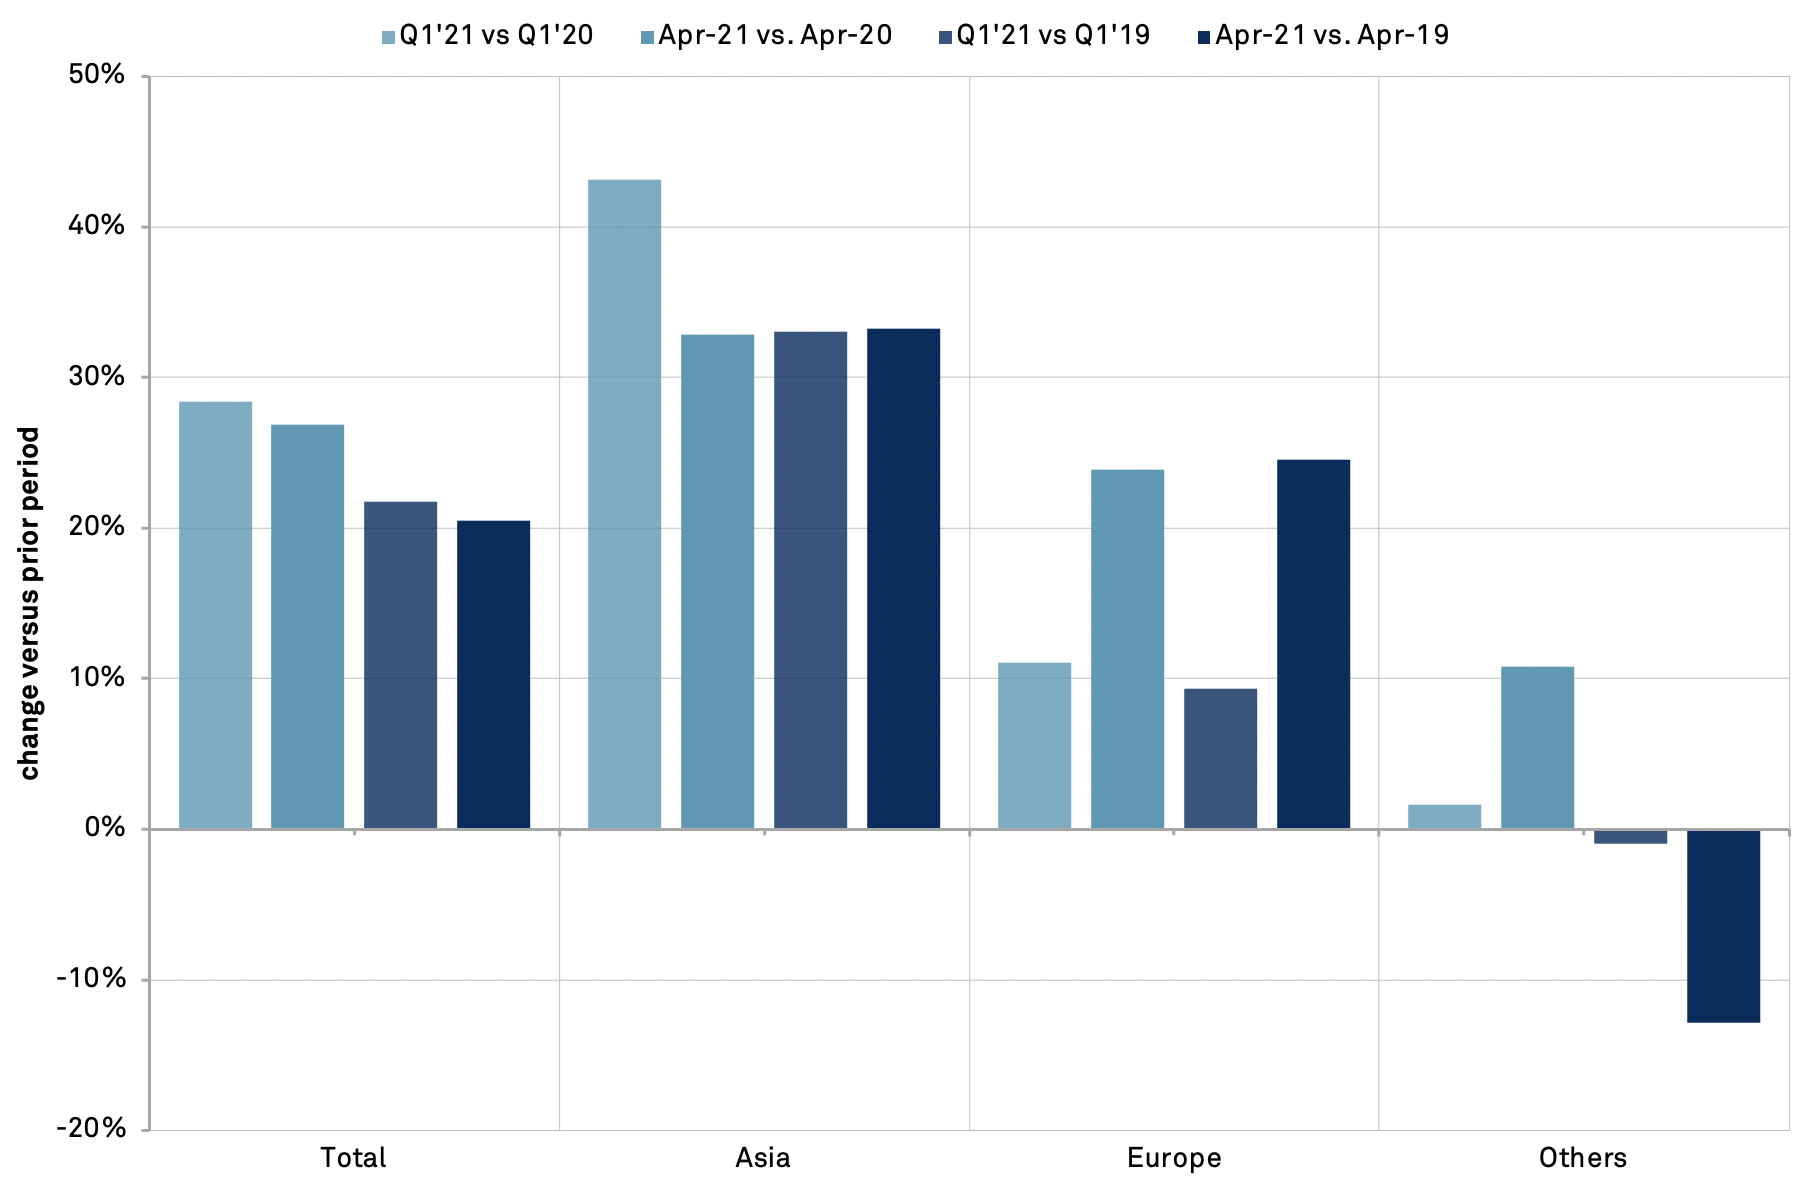
U.S. import growth by volume increased to 6.9% year over year in February, overcoming the downward pressure created by the Lunar New Year holiday. Asian routes drove that growth, with imports originating ports other than China up by 17.2% year over year. Chinese ports followed, increasing i... Read more →

20220119-rates-600x413

Matson, Amazon forwarding lead December imports; rates inch up

Shipping rates continue to increase out of China, up 1.7% week to week as of the 14th. This was driven by increases in China to Europe rates, up 4.1% week to week and up 126.0% since the end of 2020. Carriers are likely enjoying these increased rates, posting increased profitability at the ... Read more →

20211215-rates-scatter-600x397

ZIM leads 2M, Ceva imports surge in November

Carrier and forwarder markets in November were affected by the continuing rise in ocean freight rates, up 1.2% on average after a lull in October. China to U.S. west coast routes were particularly affected, up 4.2% week to week as of Dec 10, and up 23.8% since the end of July. Other routes ... Read more →

Contact

City
Subscribe today to get full access.
Country Name
Subscribe today to get full access.