 Es
EsThe Chinese Ministry of Commerce has launched the first round of retaliation against American imports in return for the duties on steel and aluminum exports applied by the U.S. under the section 232 review. As outlined in Panjiva research of March 21 the U.S. tariffs are equivalent to $431 million based on exports from China of the products covered and rates of 25% on steel and 10% on aluminum. Those rates may increase given the wide-ranging exemptions that have been granted so far.
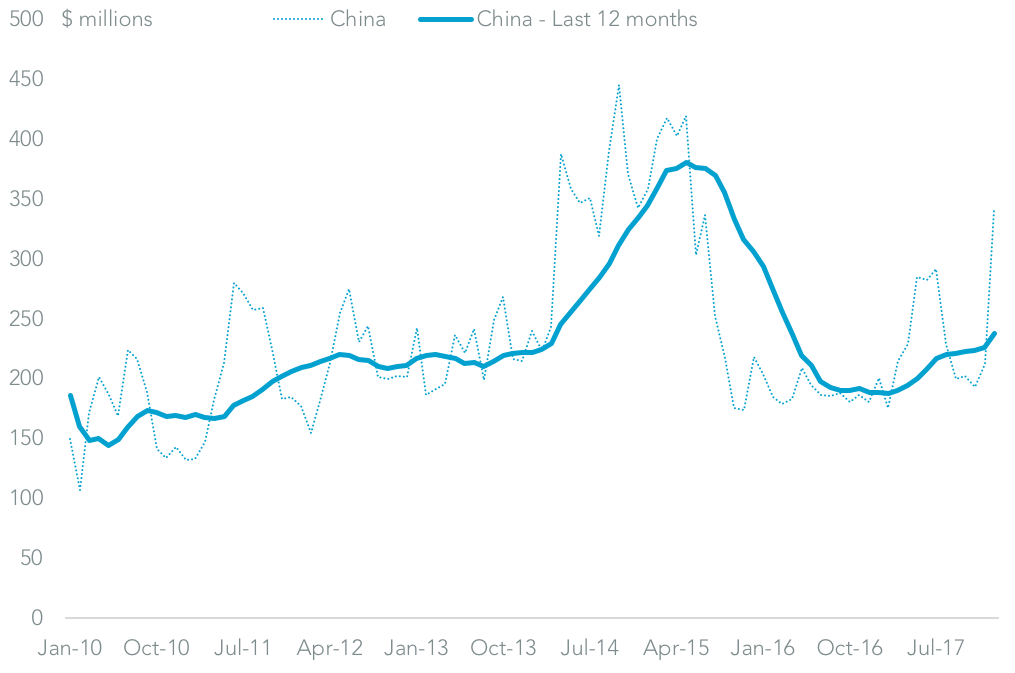
Panjiva data shows there has certainly been a rush to “beat the tariffs” from Chinese suppliers, with imports in the three months to January 31 having risen 31.3% on a year earlier. That resulted in shipments in January being the highest since May 2015.
Source: Panjiva
The duties applied by China are applied to goods worth $2.97 billion according to the Ministry’s press release. The total of $644 million is based on 25% of duties on $1.92 billion of imports of pork and recycled aluminum among others, and 15% duties on steel pipes, ethanol and other agricultural products worth $977 million. That’s 1.5x the level of duties applied by the U.S.
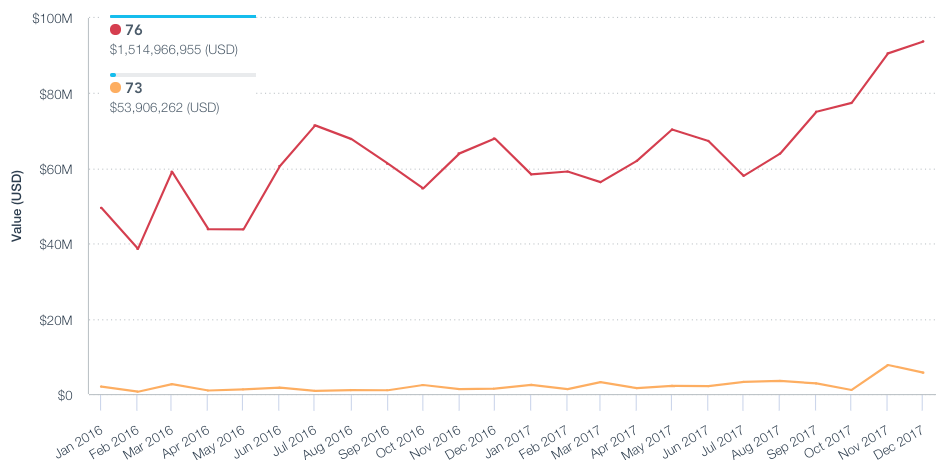
Imports of the metals covered by the new Chinese duties were worth $869 million in 2017, with 95.8% being scrap aluminum. Notably imports of the latter reached the highest since at least 2013 in December 2017.
Source: Panjiva
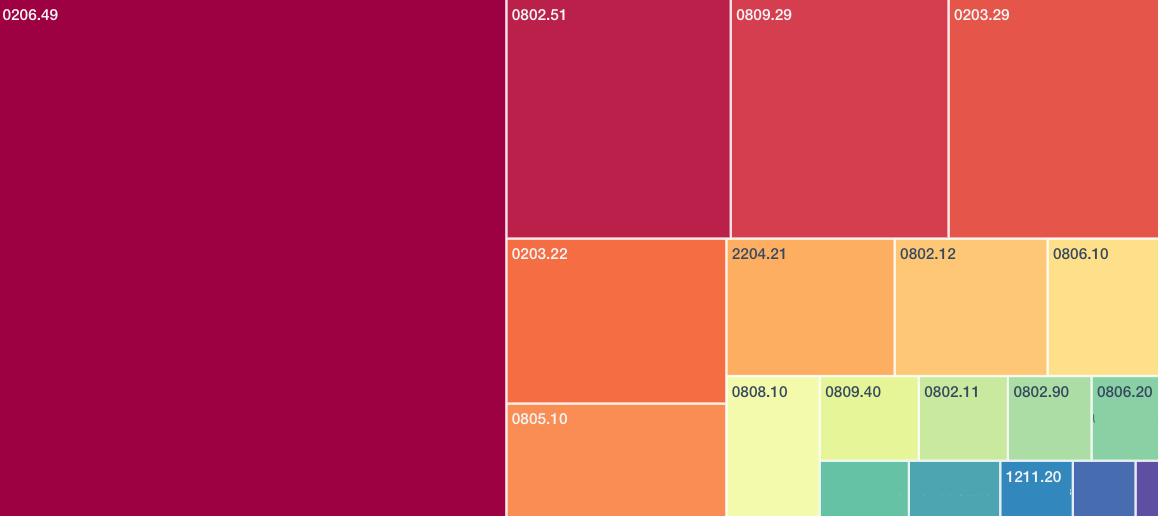
In terms of the agricultural / beverage products the biggest area of coverage is pork products, which accounted for $1.16 billion of the total in 2017. Among the others chestnuts ($175 million), sweet cherries ($170 million) and oranges ($87 million) matter most.
Source: Panjiva
This initial round of duties from the Chinese government is unlikely to be the last. With the latest round of tariffs to be applied against Chinese products under the section 301 review the level of duties applied by America could rise to $12.5 billion. Assuming a proportion response to the first round from China – namely a 1.5x reaction at rates of 15% to 25% that could equate to $75 billion to $125 billion of products sanctioned.
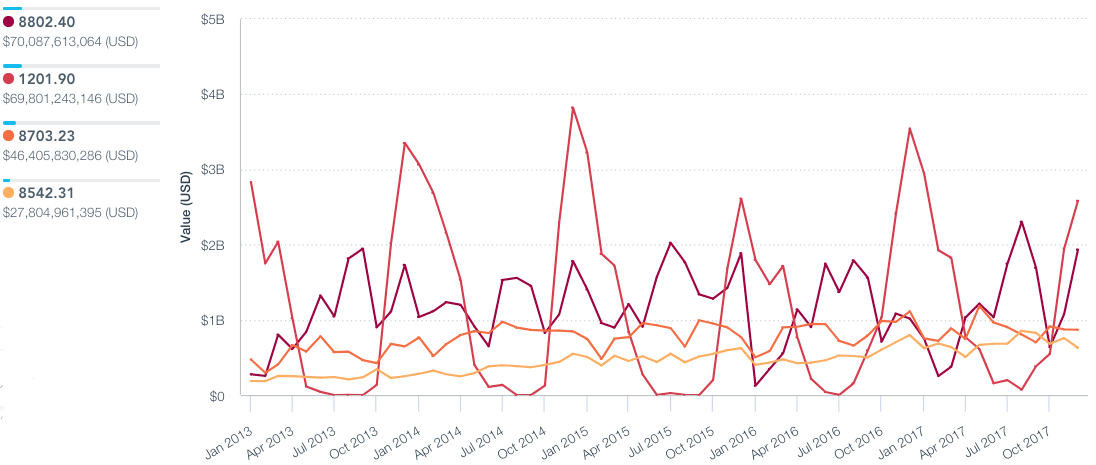
With U.S. exports to China only being worth $152 billion annually, it seems unlikely that level of reaction would be possible. In any event, the largest U.S. export lines to China – and hence most likely targets for reaction – include commercial aircraft ($14.0 billion imported in 2017), soybeans ($9.2 billion), cars ($10.3 billion) and microprocessors ($8.3 billion).
Targeting aircraft and microprocessors would be symmetrical with regards to the U.S. section 301 reactions. A “regular” trade case may already be under consideration for soybeans, while the export of cars has been a key part of America’s other trade negotiations.
Source: Panjiva


