Es
EsU.S. seaborne imports increased by 2.1% on a year earlier in August, Panjiva data shows. That was the sixth straight increase, and resulted in a new record of 1.07 million shipments. The growth rate was the slowest in nearly a year, likely reflecting disruptions late in the month from Hurricane Harvey. As outlined in Panjiva research of August 29 this may have cut imports by around 6,500 TEUs per day, or 0.6% of the monthly total.

Source: Panjiva
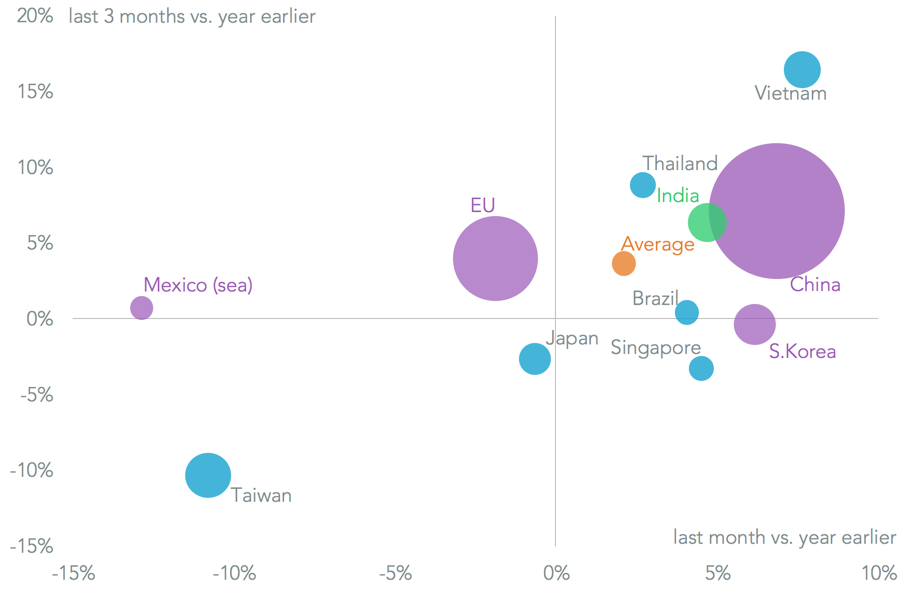
That is not to say that Harvey had no effect. Imports that head into the U.S. east coast dropped, including a 1.9% slide in shipments from the European Union – the first drop since December 2015 – and a 12.9% slump in those from Mexico by sea. Meanwhile shipments from Asia went from strength to strength. Imports from China climbed 6.9% and shipments from South Korea jumped 6.2%, possibly reflecting concerns about hawkish commentary on tariffs and trade deals from President Donald Trump.
Source: Panjiva
A similar pattern can be seen in tariff-sensitive sectors including autos (7.5% higher in the traditional slow month for the year) and iron/steel (which increased 4.7%). The latter represented a sixth straight rise, confirming the cost of delay in decision-making regarding the administration’s section 232 reviews of the steel and aluminium sectors.
Discretionary consumer goods meanwhile saw a downturn, with apparel falling 1.7% and toys by 8.5%, though furniture continued to buck the trend with a 10.5% rise.

Source: Panjiva
Looking ahead to the full year growth of 3.2% to reach 11.5 million shipments should be possible, based on prior year’s patterns. These have typically included shipments in September that are lower than August – reflecting the timing of the peak shipping season. Last year the pattern was distorted by the failure of Hanjin Shipping at the end of August. This year Hurricane Irma may have a similar effect – it may disrupt 10,600 TEUs per day – raising the stakes for the shipping industry in October.

Source: Panjiva