Es
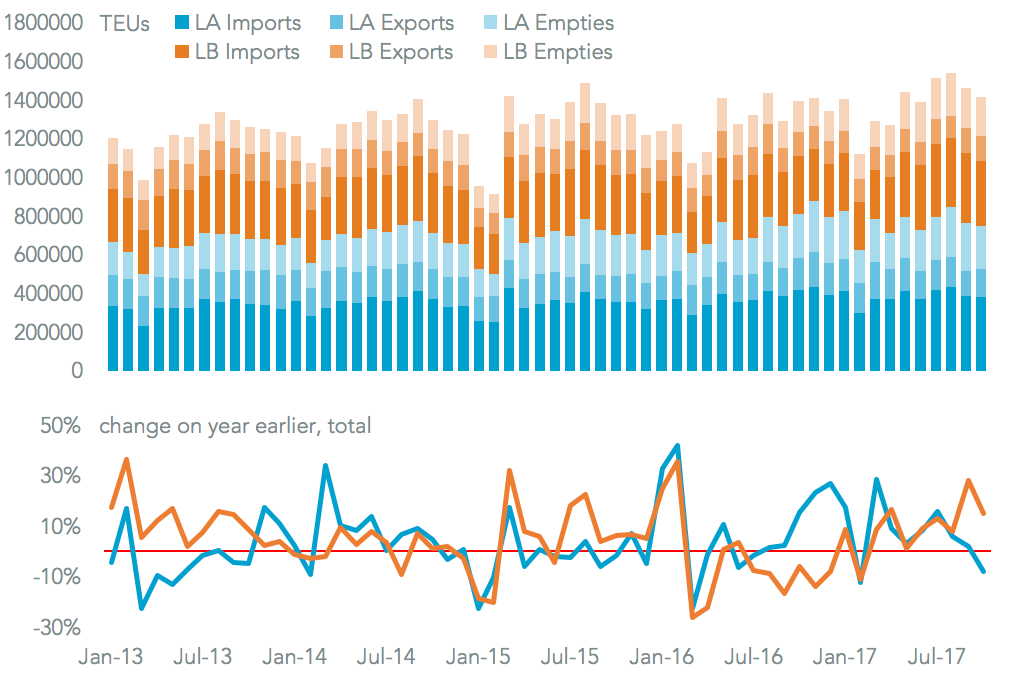
EsContainer handling through California’s three main ports slowed markedly in October. Volumes handled through the ports of Los Angeles and Long Beach climbed by just 1.5% on a year earlier. That compared to a 13.2% recovery a month earlier, which was partly the result of the prior year including the failure of Hanjin Shipping during the month. Import growth outpaced exports, growing 1.2% vs. a 7.8% decline.
That marked a contrast to the east coast ports in Virginia and Georgia which saw the reverse pattern, as outlined in Panjiva research of November 10. There was also a notable slowdown in activity in Los Angeles, where total volumes dropped by 8.1%. The slide was the first since July 2016 when excluding February’s holiday-driven decline and included a 13.3% slump in export volumes. Wildfires across the state may have trimmed economic activity in that regard.
Source: Panjiva
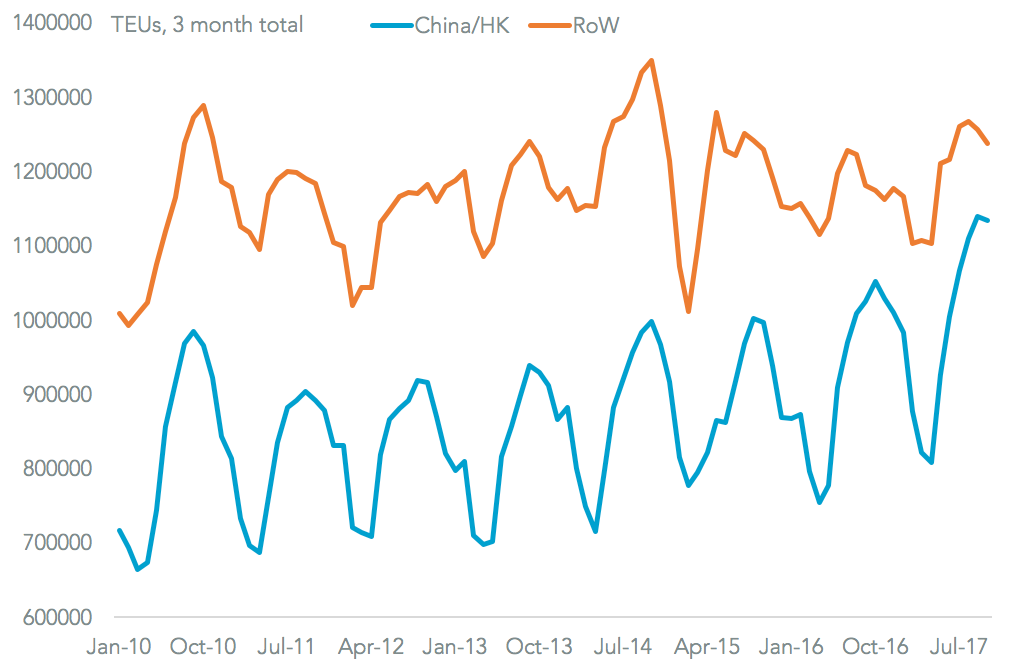
Los Angeles also suffered an 8.1% drop in import volumes, making it one of the worst performing major ports in the nation for the month. That was made up for by extra incoming volumes to Long Beach. Panjiva data shows that the 1.2% rise in volumes was driven by continued strength in Asian export economies, with shipments from China and Hong Kong having risen by 5.0%.
On a trailing three month basis that equates to a 7.8% expansion vs. 5.4% for the rest of the world. Any downturn in Chinese exports would have an outsize effect on LA/Long Beach – they accounted for 45.5% of the total in the past quarter. That makes the recent slowdown in business sentiment towards exports in China a key concern.
Source: Panjiva
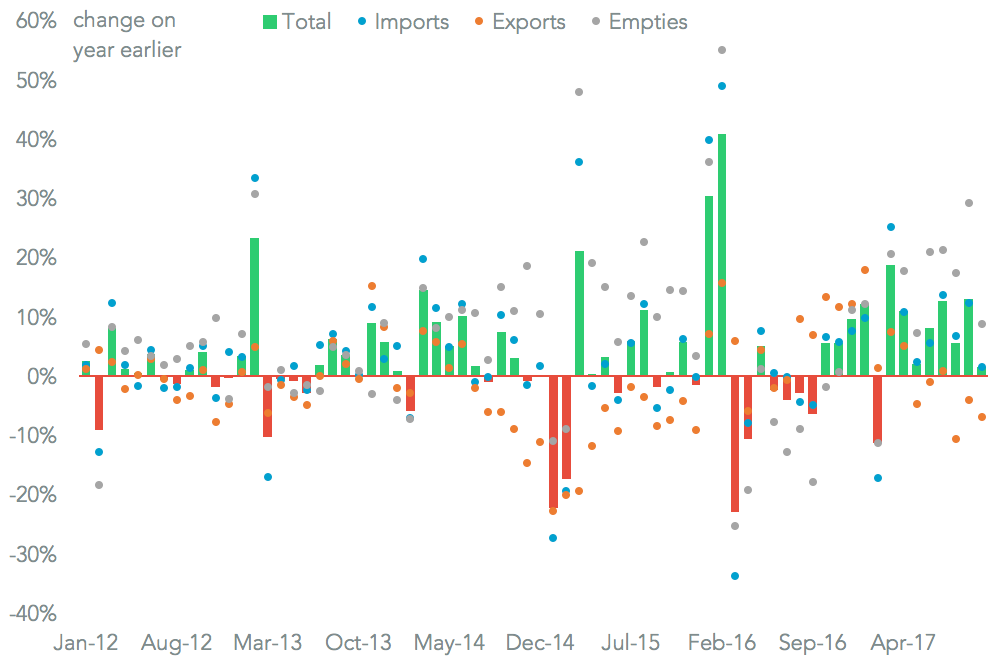
The Port of Oakland saw a similar performance, with total handling slowing to 1.8% from 12.7% a month earlier. Imports of full containers climbed 6.4% vs. a 4.0% drop for exports, though shipments from China increased by just 3.8%. Putting all three together, handling through California’s ports slowed to just 1.6%, the slowest since July 2016 when excluding seasonal and Hanjin Shipping-related effects. Worryingly, when excluding the transit of empty containers the volumes handled dropped 1.1%. The trade boom may be over for California’s ports.
Source: Panjiva