 Es
EsContainer handling through California’s big three ports grew 7.3% on a year earlier in 2017, reaching a new record for a full year of 19.31 million TEUs. Oakland was the slowest growing of the three with an improvement of just 2.2% on a year earlier as export handling fell 1.9%. Export handling across the state increased by 1.2%, reflecting a potential weakening of the domestic economy including the negative effect of a series of international disasters.
Source: Panjiva
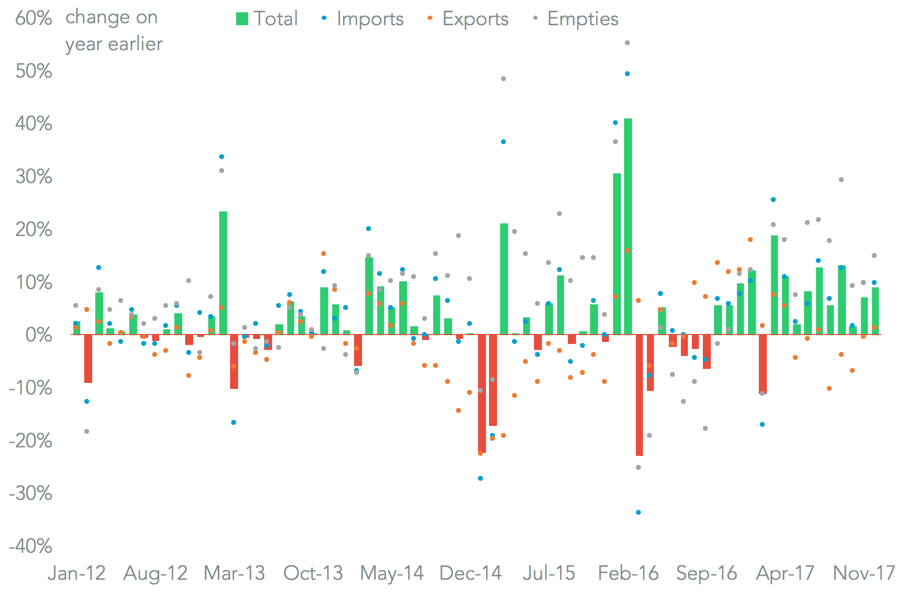
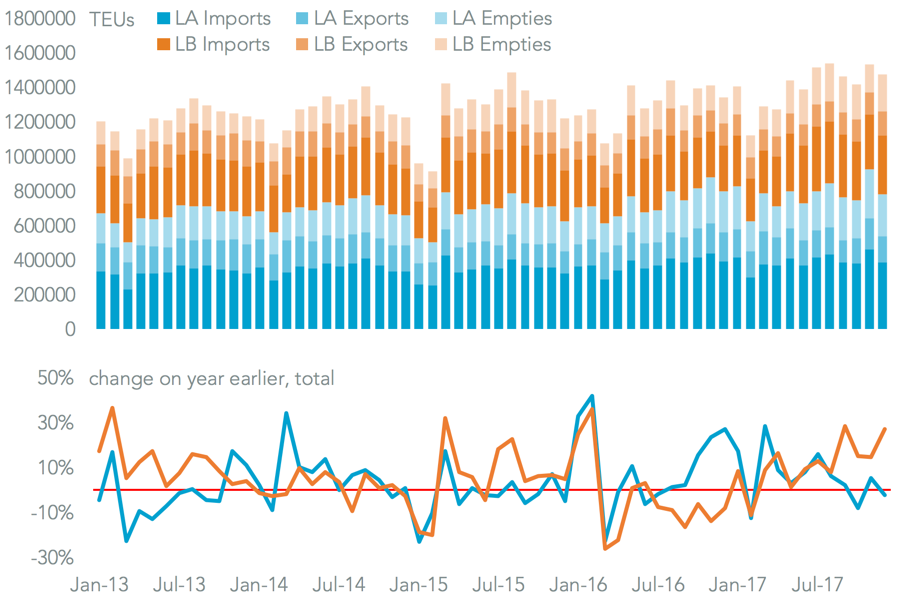
The Port of Long Beach ended 2017 on a high point, with container-handling having increased by 27.0% compared to a year earlier, bringing the full year total to 7.54 million TEUs. That was 11.4% higher than a year earlier and far outpaced Los Angeles which grew by just 5.5% to reach 9.34 million TEUs.
Long Beach’s performance reflects an increased share of incoming traffic, with imports having climbed 12.2% for the full year vs. 3.8% for Los Angeles. By contrast outgoing traffic was in Los Angeles favor, with a 4.5% rise in full containers compared to a 3.9% decline for Long Beach resulting from a poor performance over the summer.
Source: Panjiva
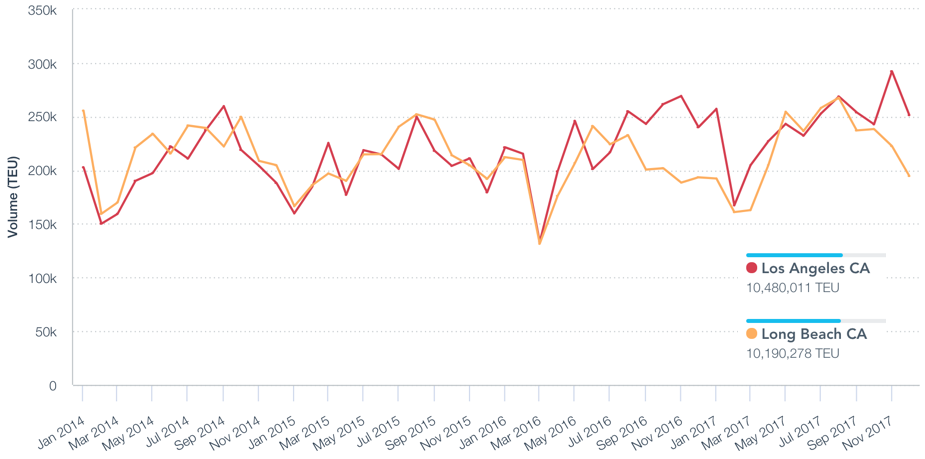
Long Beach has outperformed Los Angeles on a number of key routes. Panjiva data shows Long Beach saw an 8.7% rise in shipments from China and Hong Kong, while for Los Angeles the expansion was 7.1%.
Source: Panjiva
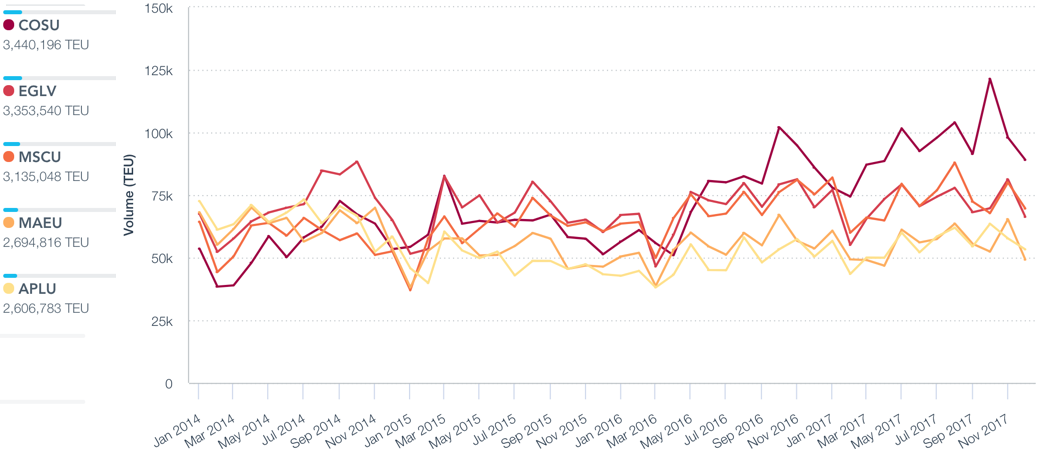
COSCO Shipping continued to be the largest shipper into the two ports combined, and extended its lead after expanding by 25.1% on a year earlier to reach 1.12 million TEUs. COSCO Shipping’s technical lead will widen further when it completes the integration of Orient Overseas, as outlined in Panjiva research of January 3, which had a number four position with 683,067 TEUs. MSC’s deliveries expanded by a more modest 5.9%, but that took it past Evergreen (2.0% better) to become the second largest shipper. CMA-CGM (via APL) grew 13.9%, but remained fifth behind Maersk (2.2% better).
Source: Panjiva
COSCO Shipping also had the highest volume route-pair with 246,493 TEUs carried from Shanghai, followed by services from Yantian by Evergreen, Maersk and MSC. COSCO’s services out of Canada were the largest non-Chinese route with 168,204 TEUs, while Hyundai Merchant Marine’s 160,191 TEUs shipped from South Korea were the largest Asian route outside China.
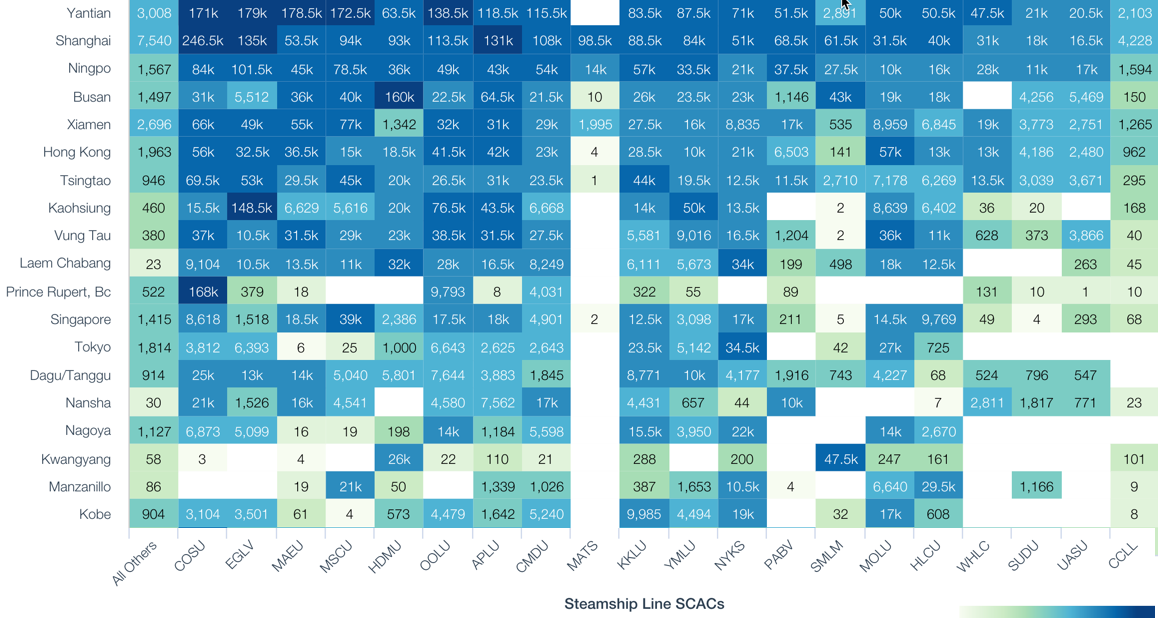
Source: Panjiva


