Es
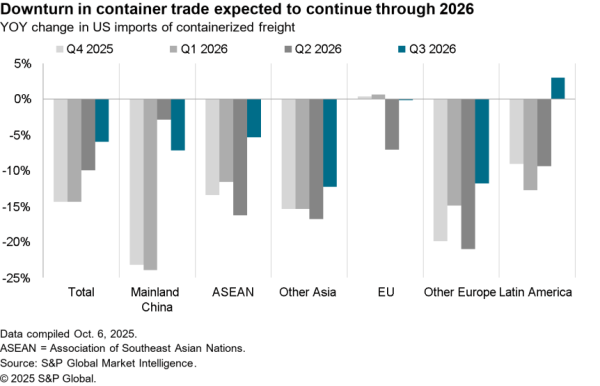
EsThere are signs that the heady ascent in U.S. seaborne imports seen in Q4’20 may be slowing but is still a long way from heading into a downturn. Panjiva’s data shows that total U.S. inbound shipments of containerized freight increased by 9.6% year over year in the first two weeks of January, down from the double digit pace seen throughout Q4’20 and most recently in a 20.4% surge in December. The dip in growth rate is still a long way from a growth rate of course, leaving significant congestion risks at the ports.
Those are beginning to take a toll, with imports to Los Angeles and Long Beach having increased by just 2.5% year over year as the port operators struggle to unload.
By contrast imports to New York / Newark, which generally are a week to two behind the west coast in receiving products from Asia, still surged 35.4% year over year. The queues seen in California might become an issue in New York too, particularly if similar staffing issues emerge as discussed in Panjiva’s research of Jan. 25.
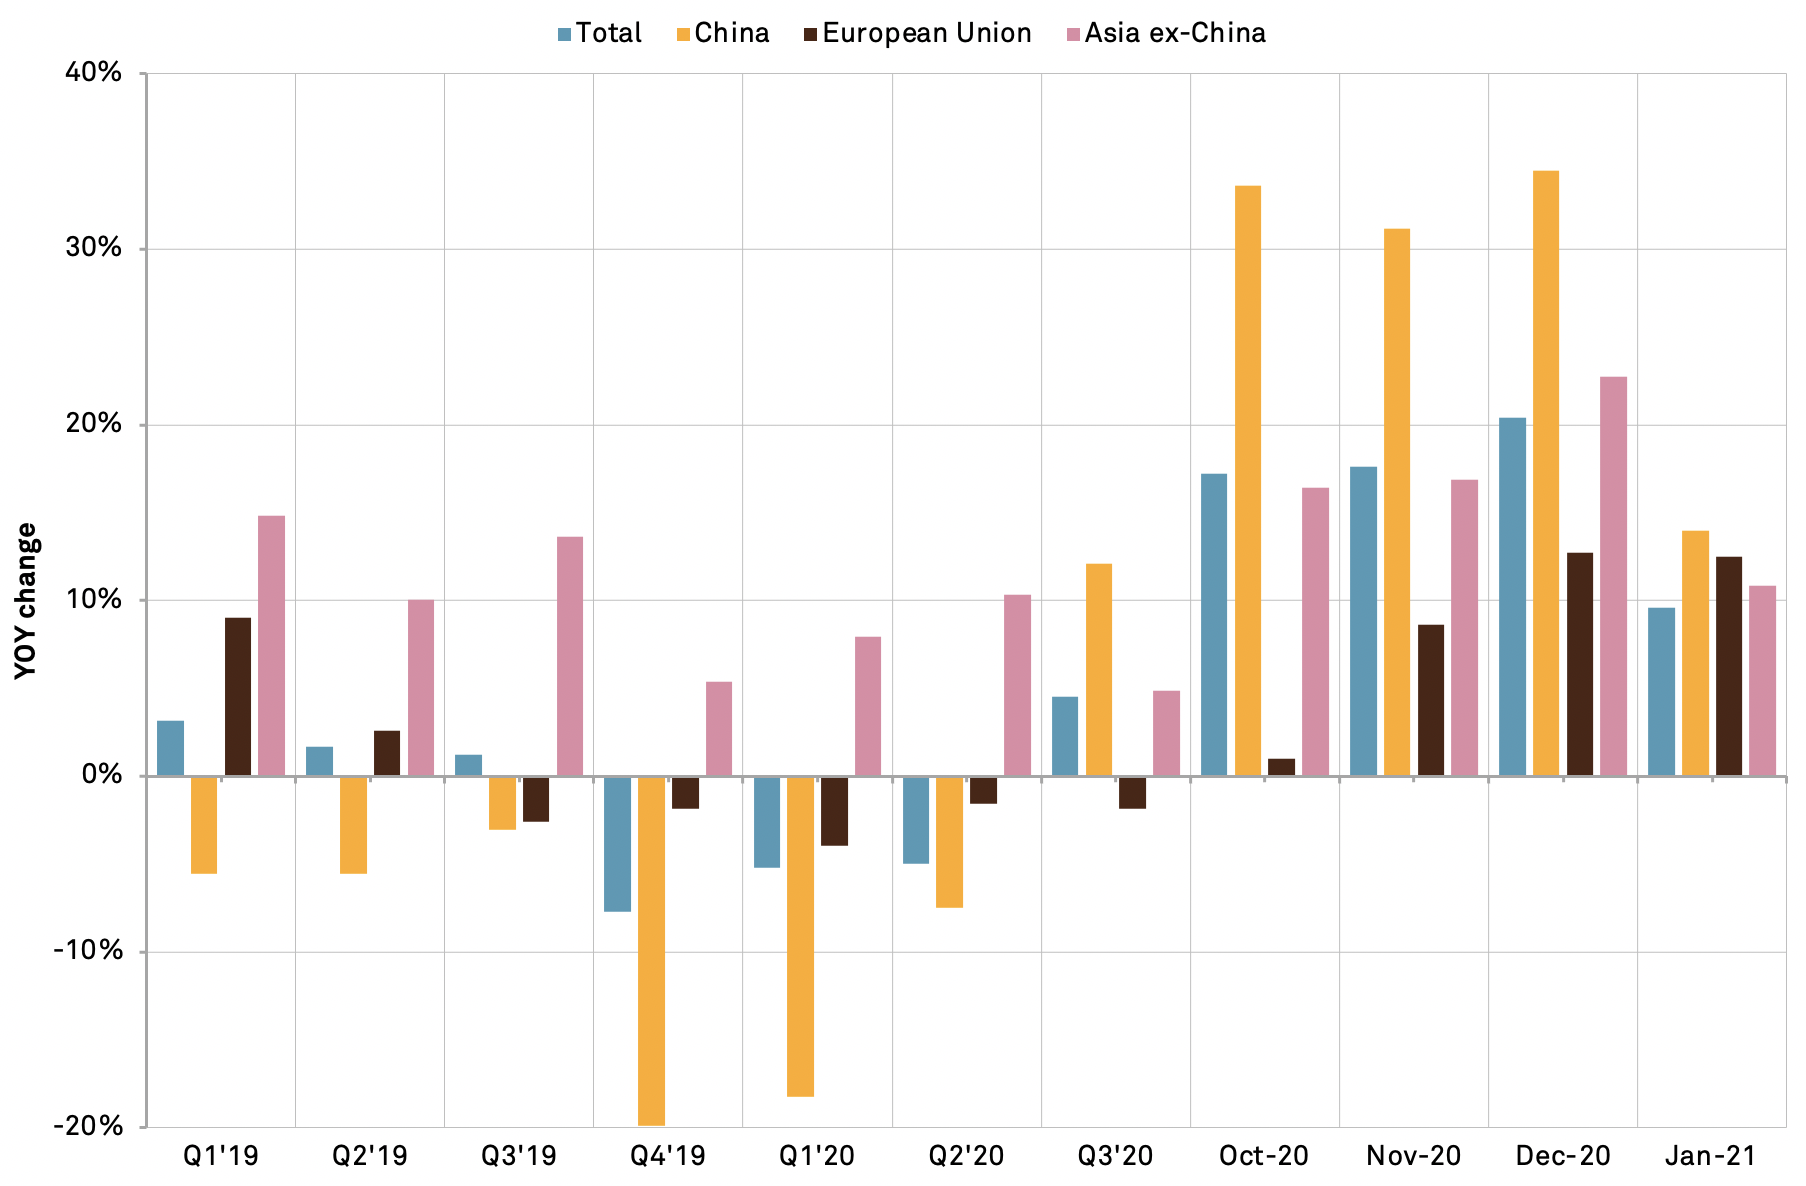
The most marked change in direction of trade flows has come in shipments from China which increased by just 14.0% year over year after rising by over 30% throughout Q4’20. Shipments from Asia ex-China similarly rose by 10.8% in the first half of January compared to 22.7% in December. Imports from the EU continued to expand at a similar rate to December with a 12.5% rate. Notably imports from the rest of the world fell by 1.9%, perhaps indicating the challenges faced by supply chains outside major shipping routes.
Source: Panjiva
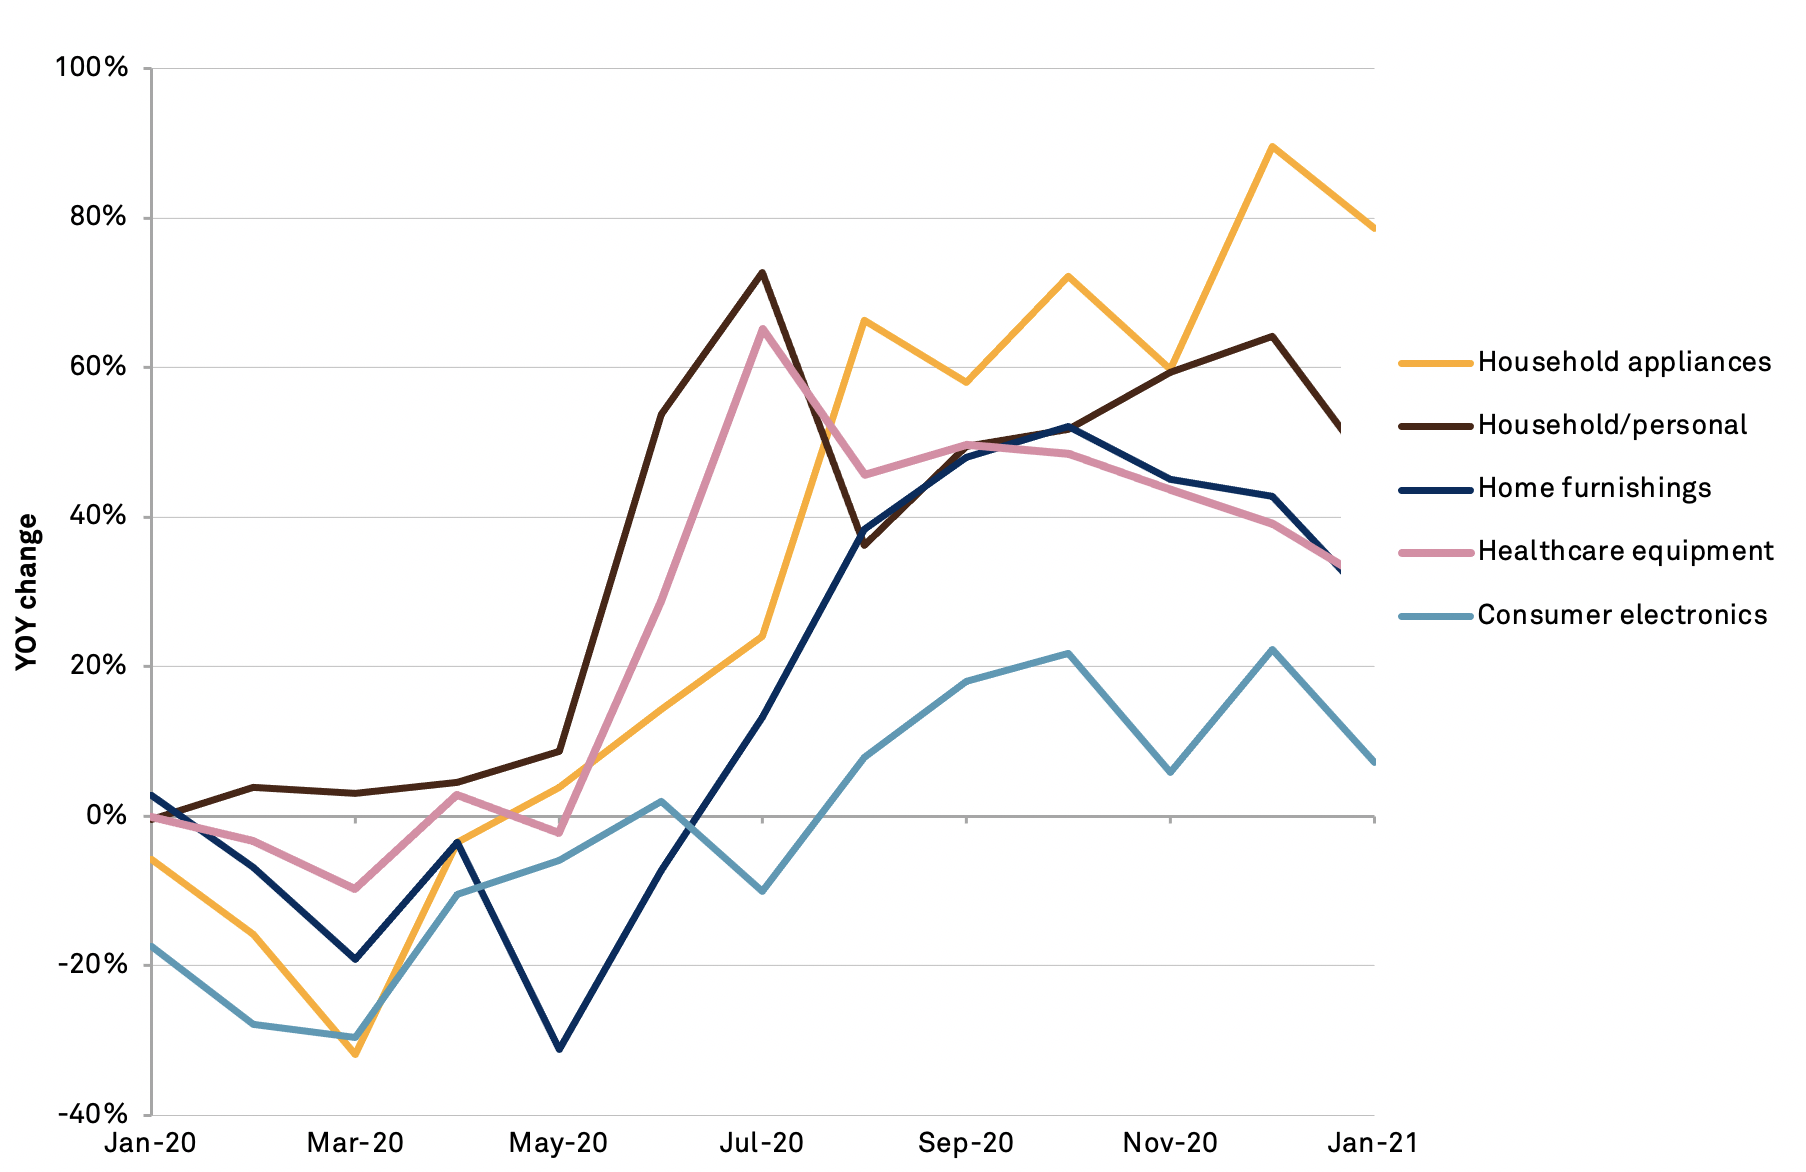
The demand side of the equation has been driven by rising consumer spending on stay-at-home products as well as the medical supplies and home / personal care products needed during the pandemic. Those have slowed in terms of their growth rate but still retain significant rates of expansion.
The most significant slowdown among the consumer discretionary products has been in consumer electronics which increased by just 7.2% compared to 22.3% in December. Similarly, home furnishings slowed to a 28.2% rate of expansion from 42.8% a month earlier. Shipments of household / personal care products expanded by 45.8%, albeit a rate that was 20-percentage points lower than a month earlier, while healthcare equipment and supplies rose by 31.0% from 39.1% in December.
Source: Panjiva