Es
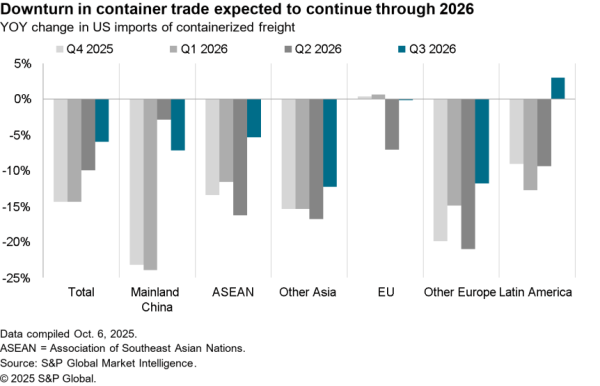
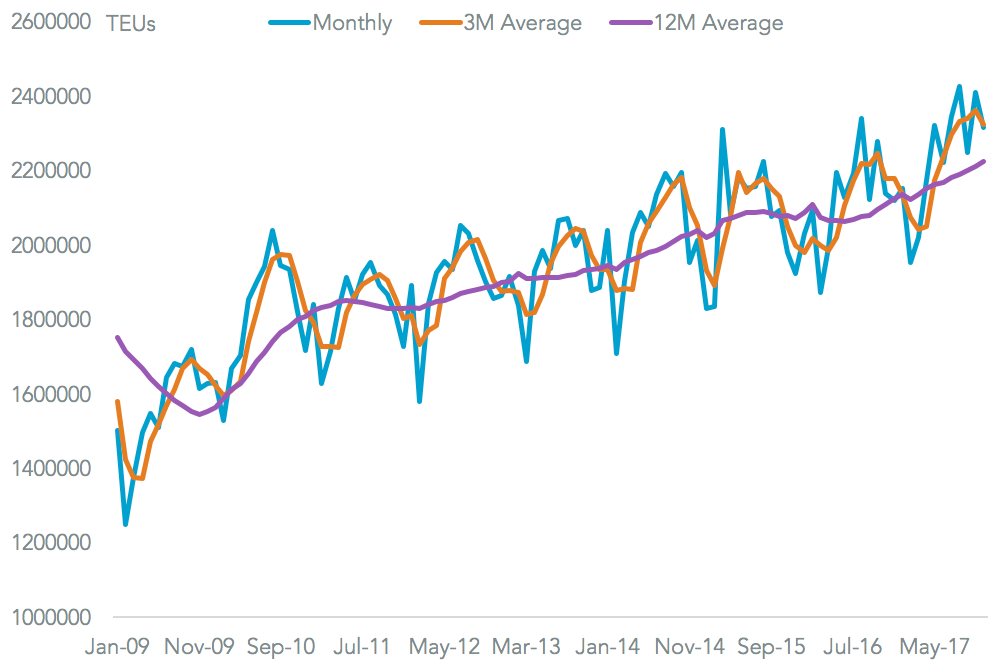
EsContainer handling at U.S. ports finished the year with a 5.7% increase on a year earlier, bringing the full year total to a 5.2% growth and 26.8 million TEUs handled, Panjiva data shows. That was driven by continued strength in imports of both consumer and industrial products, as outlined in Panjiva research of January 8, and especially a 7.1% rise in shipments from China and 17.1% from Vietnam. The figures firmly show that the protectionist rhetoric of the Trump administration had a minimal tangible impact on physical trade during the year.
Traffic in January will be a balance of: strong fundamental support for trade volumes from manager surveys and outbound Asia data from December; the later-than-usual Lunar New Year (19 days later than last year); offset by disruptions from cold weather early in the month.
Source: Panjiva
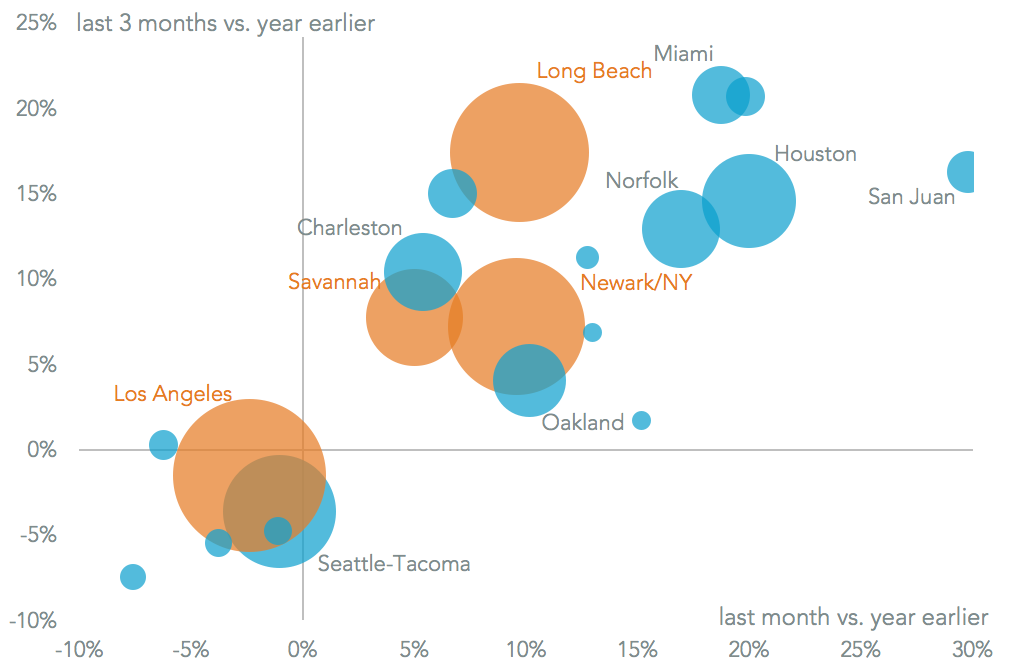
Among the largest ports Houston turned in the strongest performance with a 20.0% rise on a year earlier in December, and 14.6% in the past quarter, demonstrating the travails of the storms earlier in the year are firmly behind it. The 29.3% growth in handling through San Juan is an encouraging sign that the recovery process is continuing apace, though still has a lot further to go.
Charleston’s 17.0% rise in December suggests it is still benefiting from a superior share of traffic inbound from China via the Panama Canal vs. regional competitor Savannah which grew just 5.0%. On the negative side other continuing trends have been the underperformance of Seattle / Tacoma (1.1% lower) and a strong performance from Long Beach than LA (9.7% higher vs. 2.4% lower).
Source: Panjiva
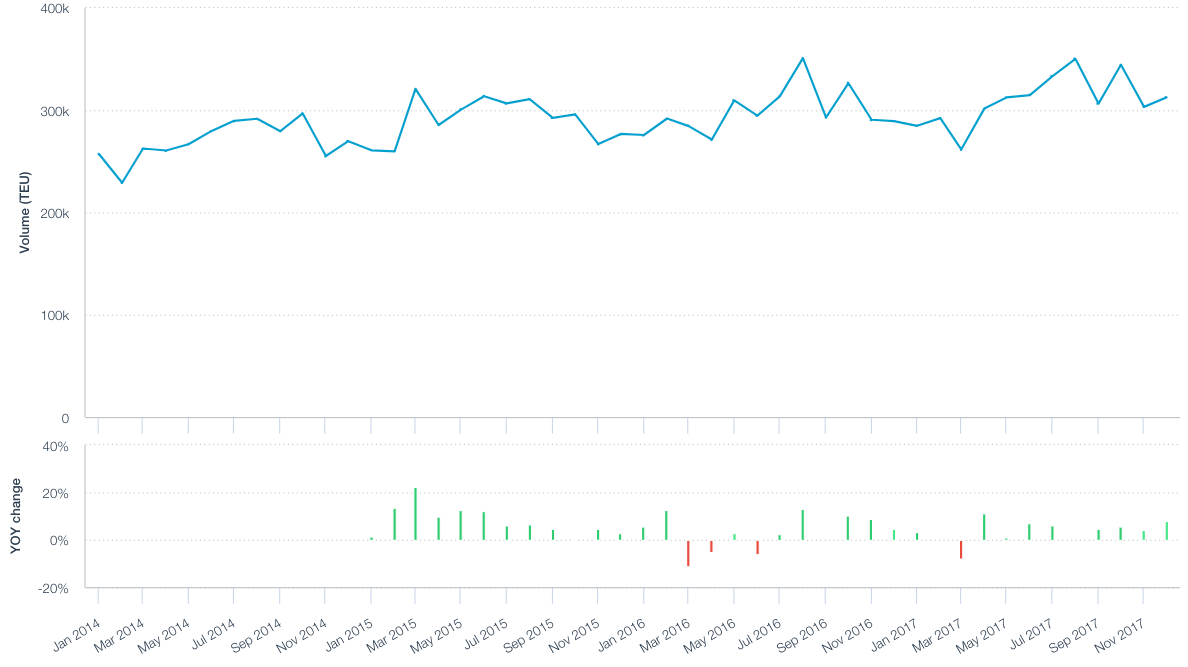
Handling through the New York / Newark Port Authority rose 9.6% in December, the fastest rate of growth since April. The accelerated growth likely reflects the later-than-expected impact of the raising of the Bayonne Bridge and related visits from larger container vessels.
Source: Panjiva
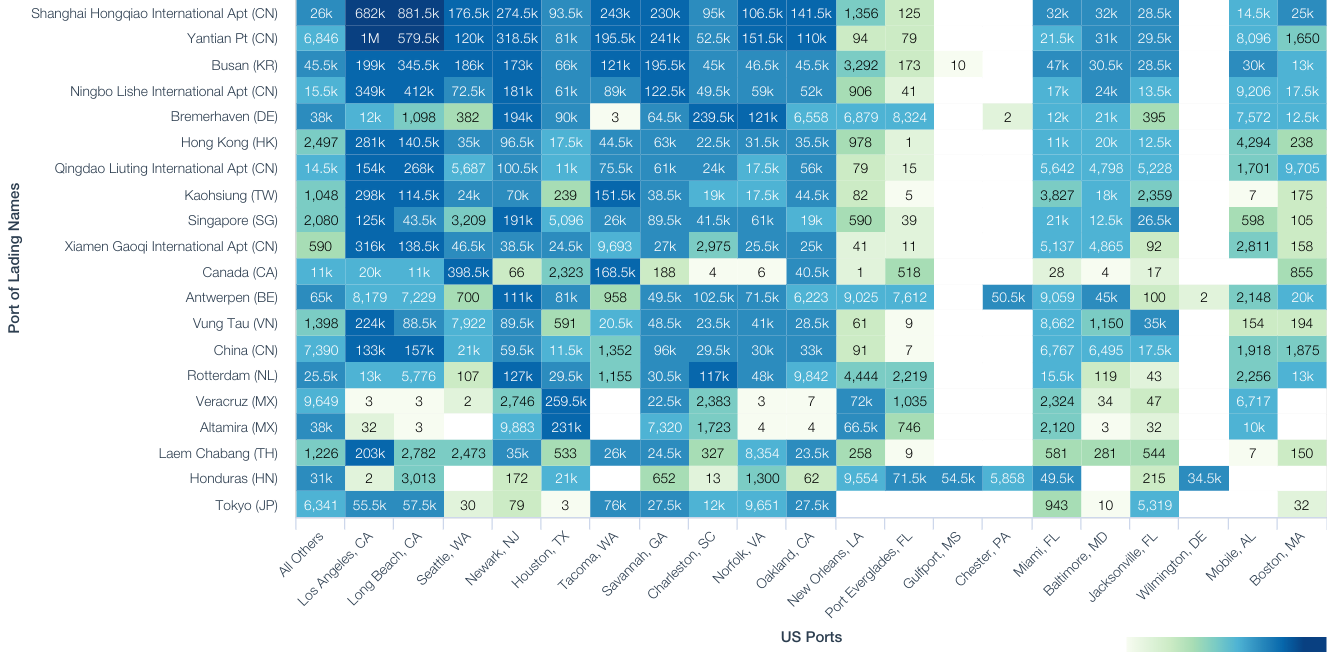
Taking 2017 as a whole the most import port-to-port pairs continued to be dominated by trans-Pacific trade with eight of the top 20 routes being based on China into Los Angeles or Long Beach. The largest port pairs outside California include Vancouver to SeaTac (398,701 TEUs), Shanghai to New York (274,265 TEUs), Veracruz to Houston (259,376 TEU) and Bremerhaven to Charleston (239,504 TEUs).
Source: Panjiva