 Es
EsMaersk has updated its service schedule to include an eastbound service, via the Suez Canal, to Montreal and Halifax from China through Malaysia and Spain with the next departure being June 15. That follows the initiation of the Med-Montreal service as outlined in Panjiva research of May 24.
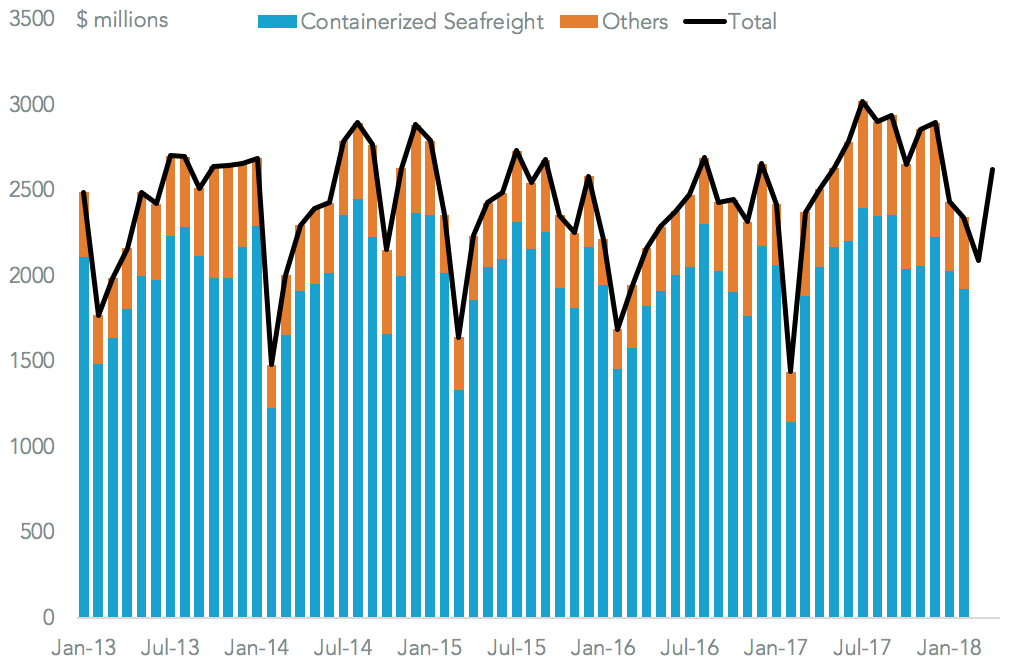
Panjiva data shows containerized freight exports to Canada from China rose 12.8% in the 12 months to February 28 on a year earlier and may have risen further after total exports to Canada climbed 11.6% in the three months to April 30 on a year earlier.
Source: Panjiva
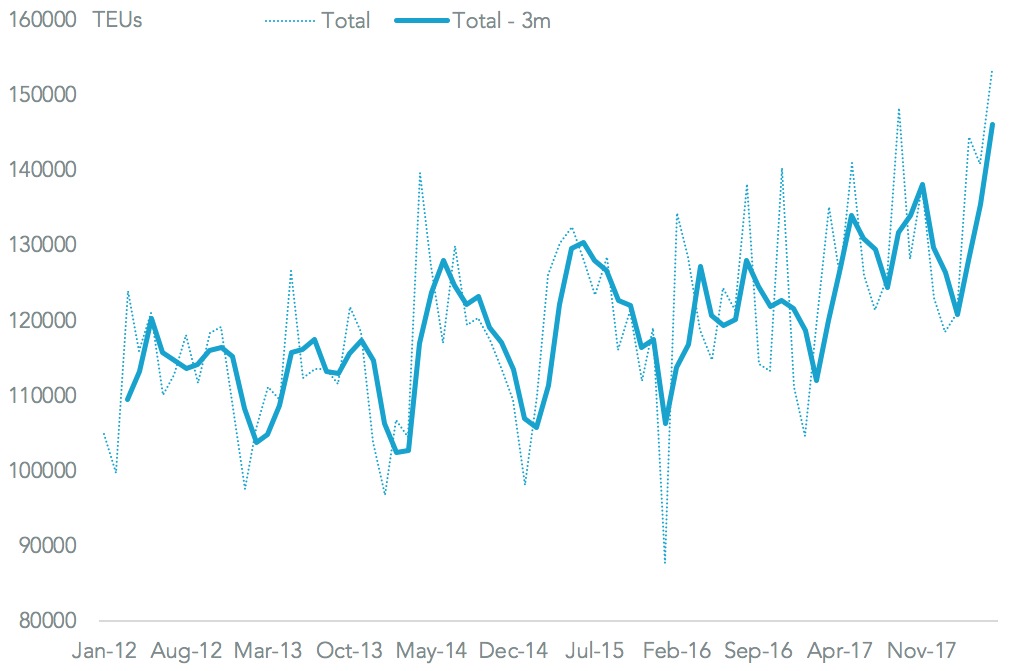
Maersk’s new service also comes as volumes handled through the Port of Montreal have begun to take off. Panjiva analysis of port data shows there was a 9.1% rise in handling in the three months to May 31. That resulted in a new record of 153k TEUs in the month of May and was the result of an 10.0% increase in inbound volumes.
Source: Panjiva
Potential target customer groups for Maersk’s new service, in terms of containerized freight shipments to Canada, include automotive parts ($908 million of trade in the past 12 months), furniture ($2.62 billion) and games ($674 million).

Source: Panjiva


