 Es
EsWe’ve taken stock of the state of play in NAFTA negotiations so far and looked ahead to the coming rounds. NAFTA negotiations started because of, and are driven by, the Trump administration’s determination to cut the U.S. trade deficit. It climbed 7% to reach $785 billion in the 12 months to October 31 and was the highest since 2008. While China and the EU account for 47% and 12% respectively, the U.S. arguably has more leverage over its NAFTA partners (11%). The autos and energy sectors have been the primary area of focus – accounting as they do for 127% of the trade deficit.
The former has caused the biggest, and potentially fatal, sticking point with regards to U.S. rules-of-origin demands. Agriculture has also been a problem, both due to Canada’s insistence on dairy industry support, and Mexican threats to diversify its food sourcing. Government procurement has also provided problems, partly explained by America’s $2.8 billion deficit in government goods and services. Opportunities abound though, including improved trade in healthcare products and the ability to lock-in Mexico’s energy liberalization. Compromises are possible, as shown by the “sunset clause”. Politics, sadly, will provide hurdles ranging from conflicts with other deals (CPTPP) to electioneering (in Mexico and the U.S.) and procedural requirements (timing of TPA).
It’s worth remembering that the renegotiation of NAFTA was triggered by the U.S., and comes in response to the basic trade doctrine of the administration of President Donald Trump. This can be summarized as: trade deficits cause lower economic growth and growing imports lead to lower unemployment, cutting them will lead to higher economic growth and increased employment.
While representing a somewhat flawed understanding of the role of trade within the GDP identifier, and long-held economic orthodoxy on the power of specialization, it does nonetheless provide an easy handle for assessing where the administration’s targets may lie.
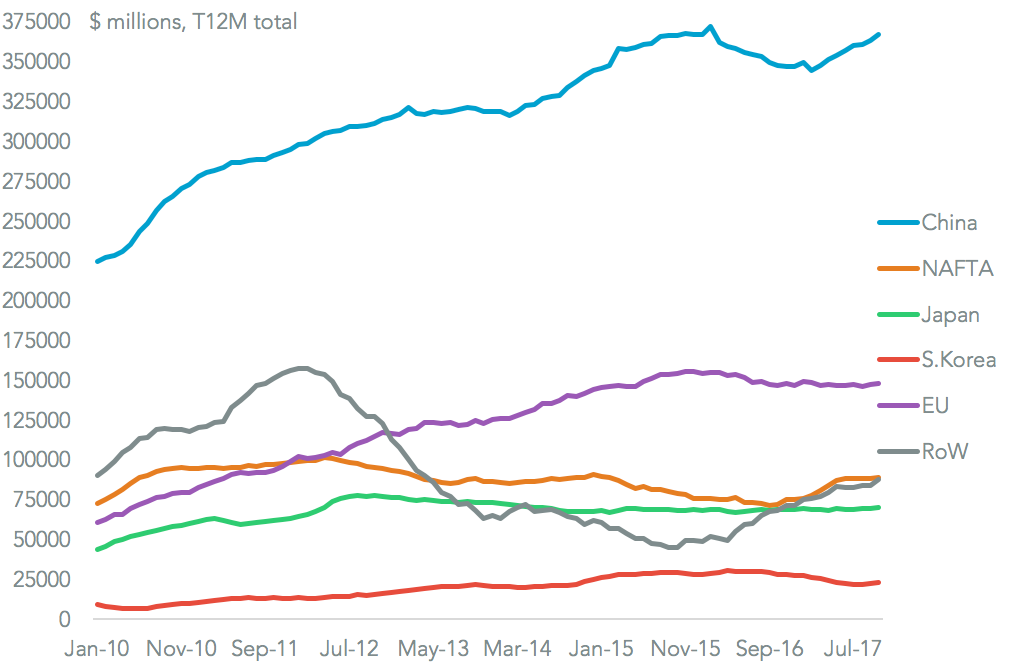
Panjiva data for U.S. imports and exports shows the total U.S. trade-in-goods deficit reached $785.4 billion in the 12 months to October 31. That was a 7.2% increase on a year earlier, and the highest since December 2008. The number one cause is China, representing 46.8% of the total, followed by the EU (18.8%) and NAFTA (Canada and Mexico, worth 11.3% combined). With limited leverage over China – outside the section 301 review – and limited appetite to take on the EU, NAFTA became the first, easiest target to tackle.
Source: Panjiva
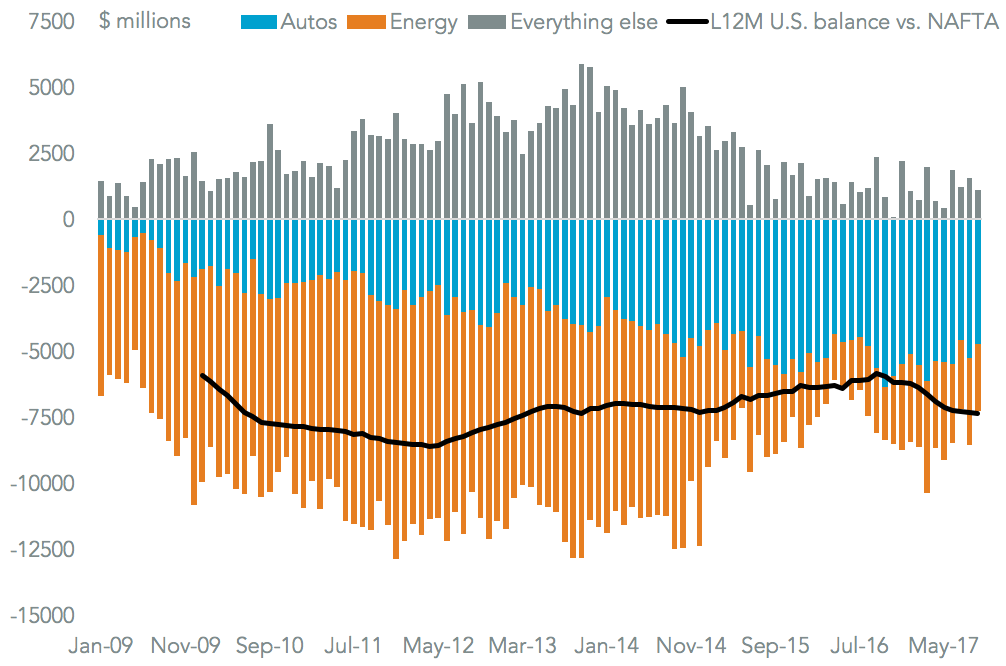
Continuing the deficit theme, the most likely targets for cutting the deficit are the automotive and energy sectors. Combined these accounted for 127% of the deficit in the past 12 months. Autos represents the larger piece at $65.3 billion, and has grown from $38.9 billion in 2012. It’s worth noting that the “everything else” trade surplus held by the U.S. represents areas where it may have to give concessions in order to win it’s broader aims.
Source: Panjiva
With five rounds of talks completed, over two-dozen chapters in the agreement have been opened, but reportedly none have been formally closed. That’s not a surprise given the usual horse-trading process in negotiations that may require chapters agreed earlier to be reopened to allow compromise elsewhere.
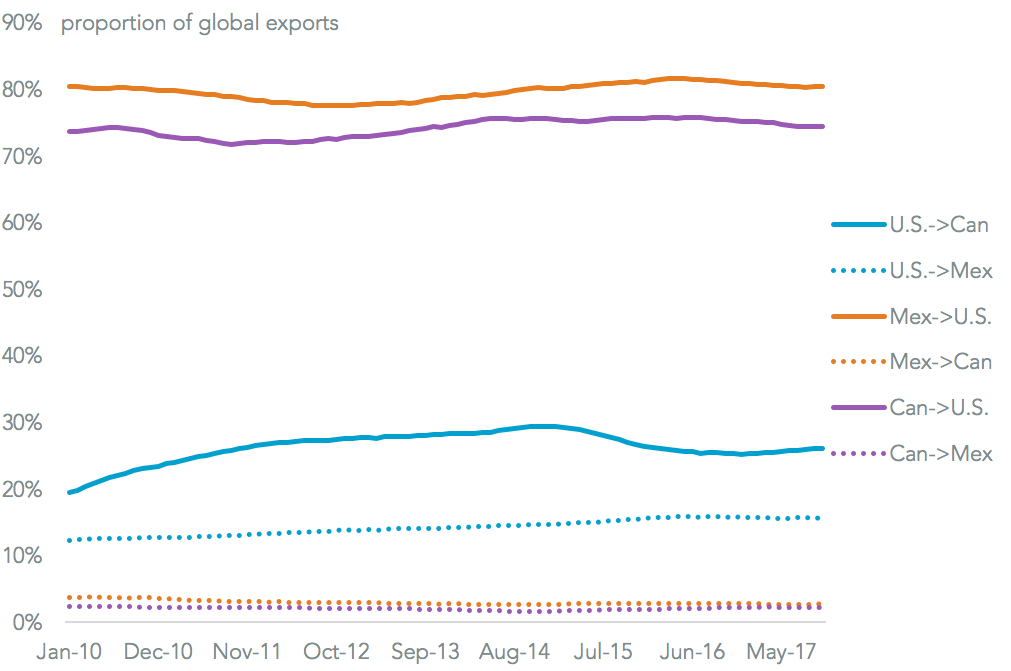
The biggest “problem” in round four was an agreement to continue talks through end March, vs. the original soft-deadline of end-December. That’s removed much of the urgency from the talks, however. While the language from Canada and Mexico became progressively more hawkish through the end of round five none of the three can afford to walk away. Canada and Mexico ship 75% and 80% respectively of their exports to the U.S., based on official figures, while 42% of U.S. exports go to Canada and Mexico.
Source: Panjiva
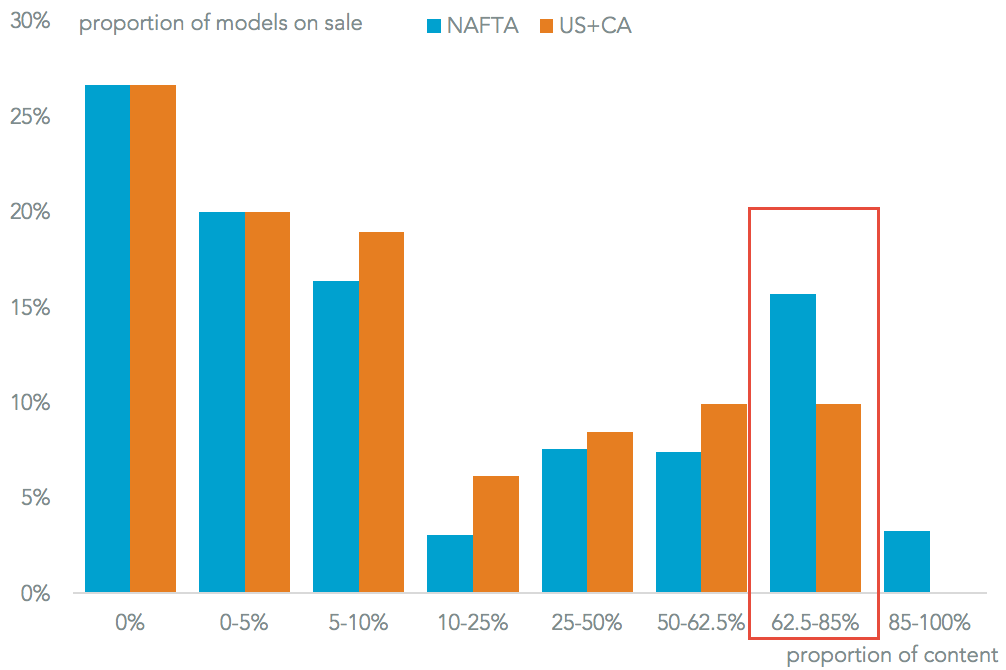
As mentioned already the biggest issue has been the automotive industry, and the biggest sticking point has been automotive rules of origin. The U.S. negotiating stance insists on increased NAFTA content in completed autos for them to cross borders duty free (85% from 62.5% currently) including a U.S.-specific content of 50%. That’s been dismissed as unworkable by both Canada and Mexico and may prove to be the one item that breaks the negotiations. Executives from the big three automakers have also warned there would be significant upheaval to their supply chains.
Panjiva analysis of NHTSA data shows adjusting the overall rule would alter the status of 87 models on sale currently on sale, or 15.7% of the total. Honda would see the biggest impact (65% of its models) followed by General Motors (48%) and Mazda (46%). The U.S.-specific element could have an even greater impact. Negotiators will also need to be aware of the unintended consequences – for example should NAFTA fail manufacturers may move out of the region altogether and rely on WTO tariffs.
Source: Panjiva
Agriculture has also proven to be controversial, and will likely remain so given the focus the Trump administration has placed on promoting farm and ranch interests globally. Canada’s defense of its dairy supply management system is one of its main red-lines, while Mexico has also threatened to increase its sourcing of food outside of the U.S. Its imports of key foodstuffs from the U.S. have already fallen to 64.6% of the total from 66.9% in a single year, while U.S. farmers and ranchers rely on Mexico for 13% of all their exports.
Source: Panjiva
While agriculture is a controversial sector in trade deals of the last century, trade in services is meant to be an area of innovation in modern free trade negotiations. In that regard NAFTA has also hit a sticking point. The U.S. is insisting on reciprocal access in government procurement – namely companies in Mexico and Canada should only be able to access an addressable market the same size as their own.
That’s understandable given the U.S. government already runs its own deficit in goods and services of $2.8 billion annually (up from $426 million in 2015), Panjiva analysis of official data shows. It may be a moot point given “Buy American, Hire American” orders already in place from the administration.
Source: Panjiva
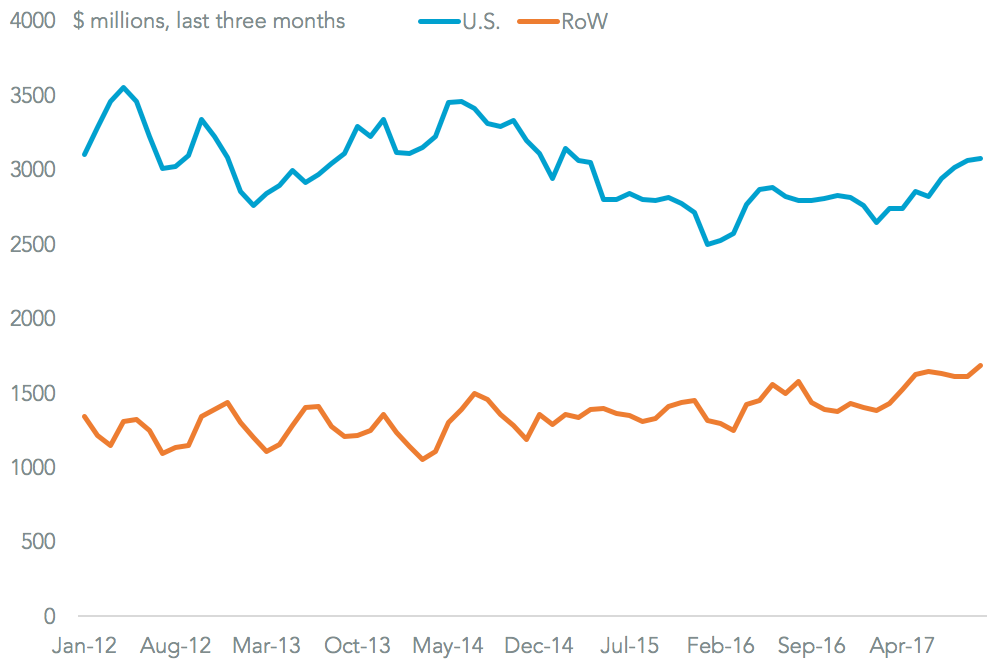
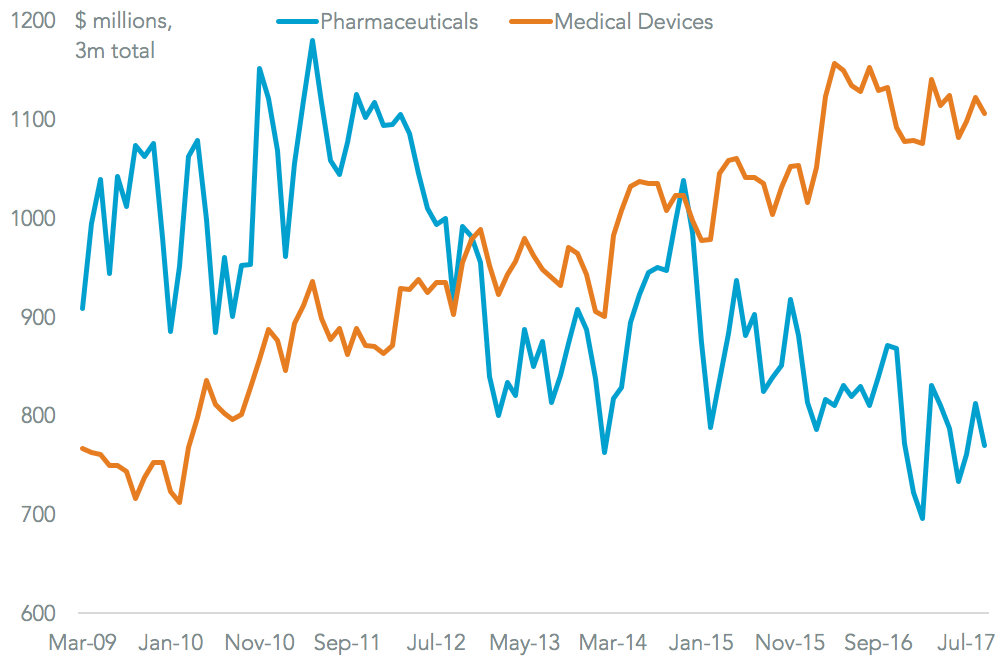
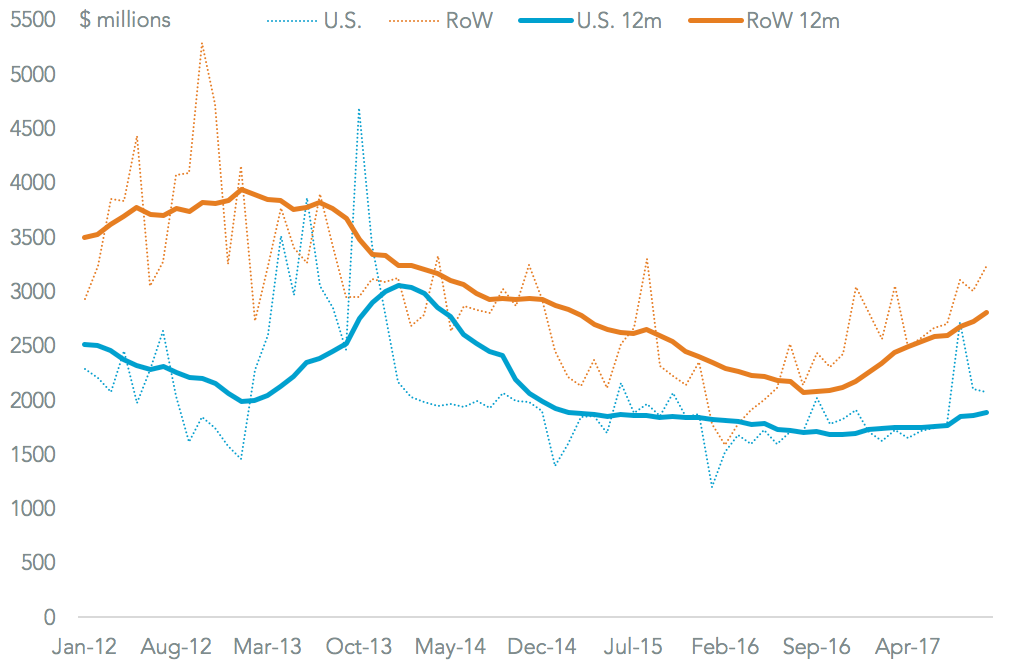
The U.S. has also called for improved access to the healthcare markets of Mexico and Canada, presumably to help boost exports by the pharmaceutical and medical devices industries. U.S. pharmaceutical exports have been in long-term decline, falling 3.3% annually over the past three years, with shipments to Canada and Mexico having fallen by 5% over the same period. Medical devices had done better, with exports to Canada and Mexico have grown by 4%.
IIt isn’t clear whether reciprocal access is planned – presumably it is – which could help reduce U.S. healthcare costs. Pharmaceuticals had been a sticky area in the Trans-Pacific Partnership negotiations, though this was more due to U.S. demands vis-a-vis Asian countries on biotechnology patents. Healthcare could therefore represent a (relatively) easy win.
Source: Panjiva
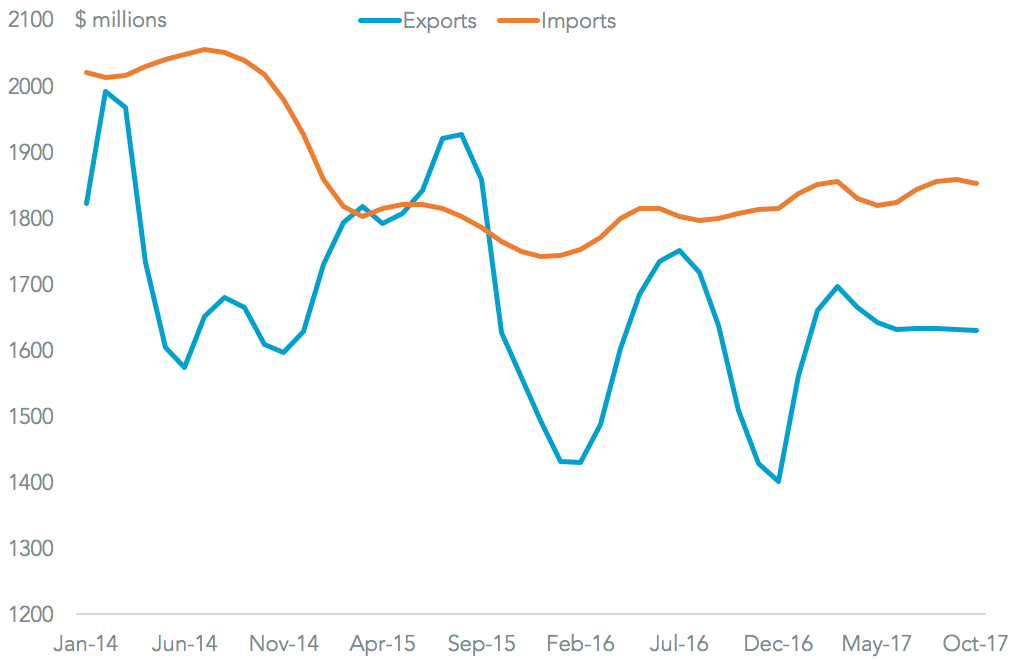
Another area of potentially positive opportunity is energy. The Mexican government is keen to lock-in the energy market liberalization (across oil, gas and power) that started in 2013. A well structured energy chapter could help achieve that. It would also potentially help the U.S. cut the energy part of the trade deficit by increasing exports of natural gas in particular.
Mexican imports of energy of all forms have climbed 24.1% in the past 12 months vs. a year earlier. The U.S. has lost market share during that process, however, with growth of 11.4%. As a consequence America’s share of Mexico’s energy needs fell to 40.1% in the past 12 months from 47.4% in 2013. Increased flows of natural gas and shale oil could help address that, particularly if – as is the case with gas as LNG – it can also be re-exported onwards.
Source: Panjiva
Another positive is that compromise, even in complex areas, appears possible. The U.S. had originally insisted upon a five year “sunset” clause that would see NAFTA end unless specifically renewed. The most recent negotiating stance, which came after round four of negotiations, was that a formal review mechanism with a fixed calendar would be used instead. That may recognize the degree to which positions can change – the U.S. trade deficit with Canada is currently 39% lower than five years ago, even while that with Mexico is 10.5% higher.
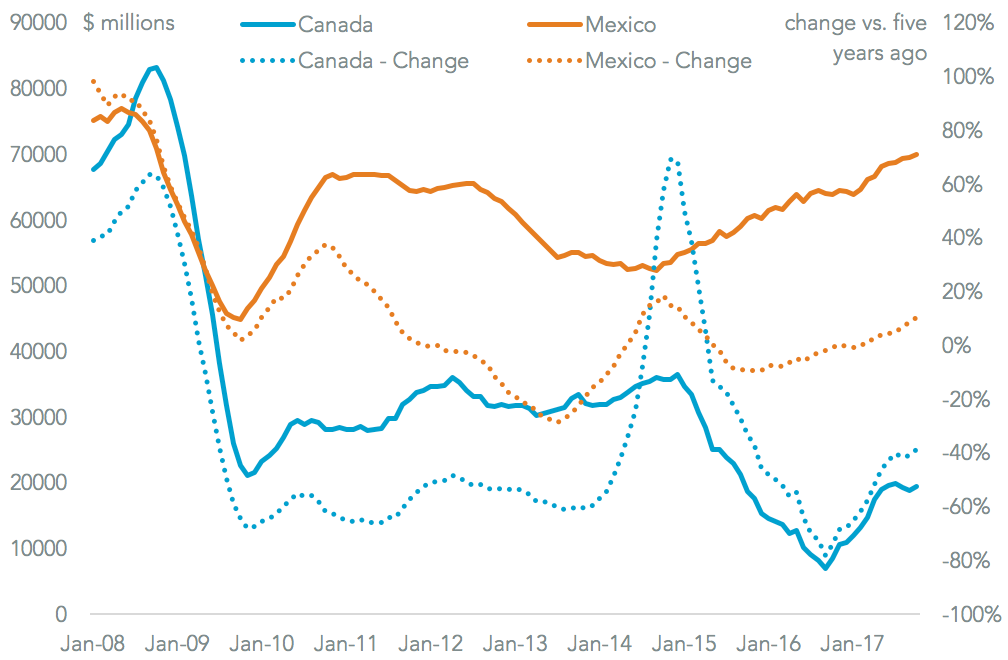
Source: Panjiva
However, NAFTA is not just about NAFTA. One challenge Canada and Mexico face is the simultaneous membership, and negotiation of, other trade deals. These can create compromises – for example on market access – that can spill over into other arrangements. Both are current negotiating the creation of the “ CPTPP” trade deal with several Asia and south American countries, the successor to TPP that the U.S. had been a part of.
Canada has also just wrapped up the CETA deal with the EU, while Mexico is in the process of wrapping up an EU deal too. For both countries it is CPTPP that is the more important at this stage, given Mexico’s exports to Japan are just 18.2% of their levels to the EU, and 30.7% in the case of Canada.
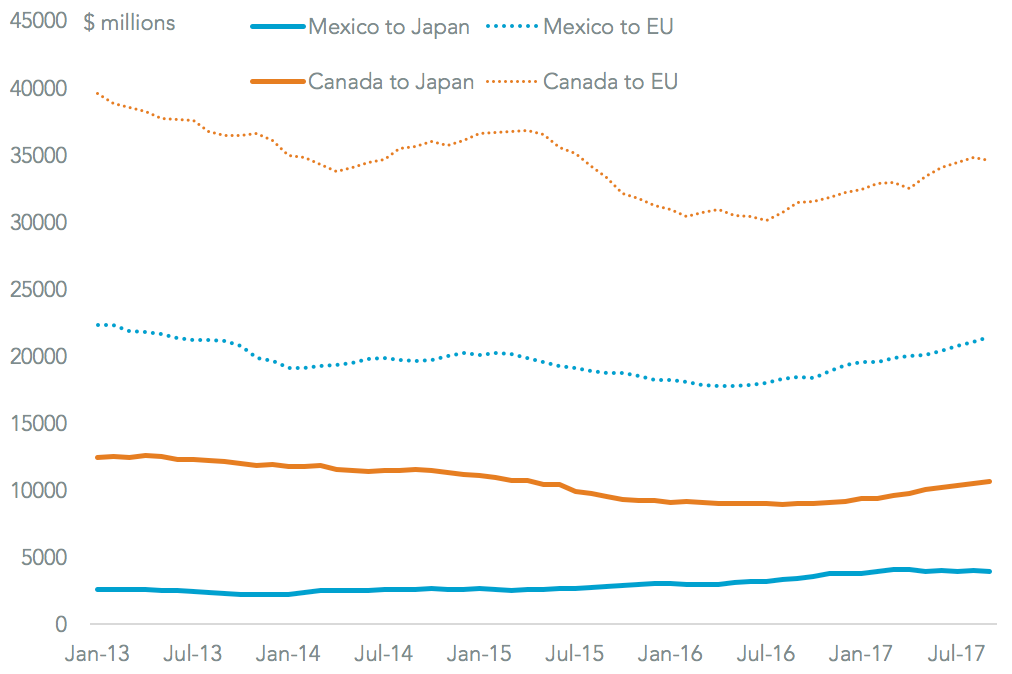
Source: Panjiva
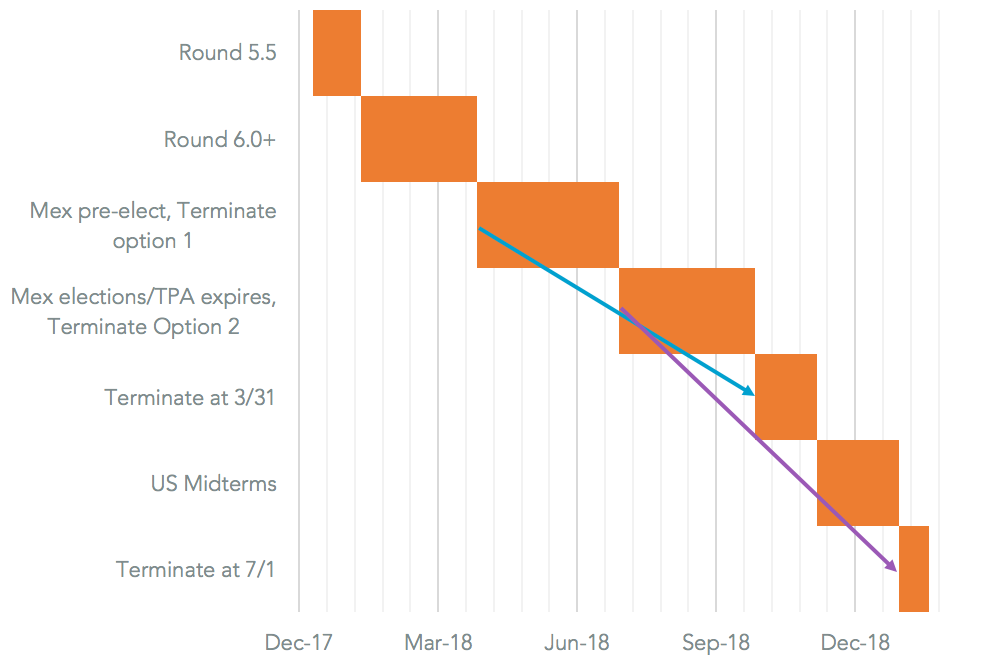
Politically it is likely to be the Mexican elections that provide a hard stop. The elections are formally held on July 1, but the electioneering process will likely start in late March. Notably the leading opposition candidate for President, Andrés Manuel López Obrador (aka AMLO) is reportedly in favor of continuing NAFTA in some form, Associated Press reports, suggesting a return to negotiations is likely after the elections.
Political timings also matter in the U.S. A final deal will need consultation with Congress. Notable, Trade Promotion Authority – which allows a simple “up-down” vote in Congress – is due to expire on July 1. This can be extended though if President Trump makes a request to Congress by April 1, and it has to be disapproved for TPA to expire. As an aside an assessment by the ITC Is also required as well as a Ways and Means report before the vote can actually occur.
That will likely turn political attention will turn to the U.S. midterm elections due November 6. President Trump therefore has two potential windows where NAFTA could be “terminated”, but that termination rescinded before it is complete. A termination notice at 3/31 would mean NAFTA expires on 9/27 – ahead of the elections. A second would be to terminate at 7/1, allowing negotiations to restart after the elections and run until 12/29 before it expires. There’s a busy year ahead.
Source: Panjiva


