Es
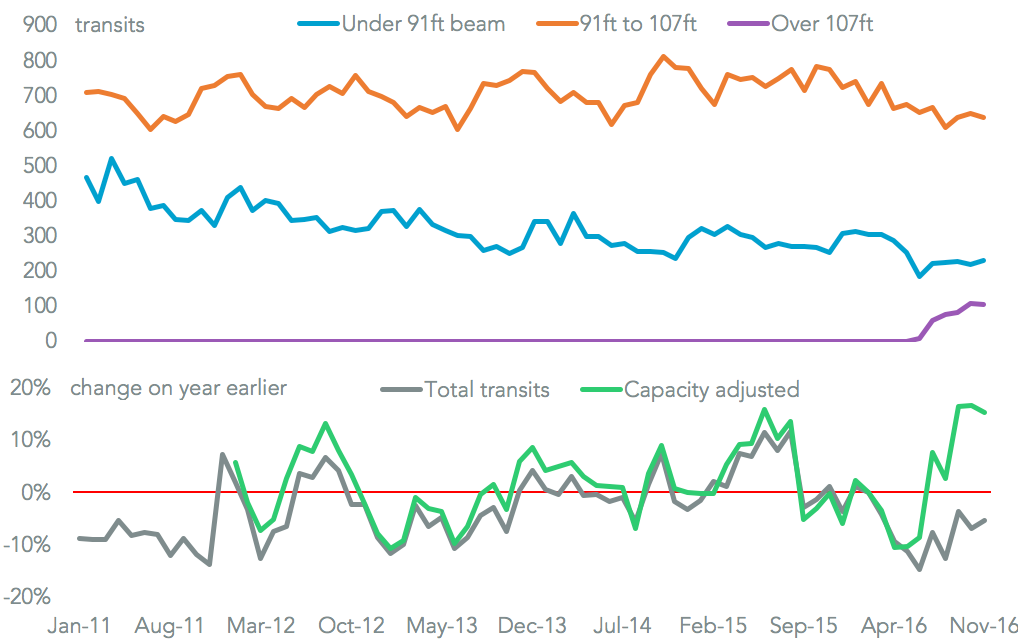
EsTransits via the Panama Canal, measured by number of shipments, fell 5.6% on a year earlier in November according to official figures. This was 0.4% lower than October, with November having just under one day of maintenance vs. none the month. However, October likely suffered disruptions due to Hurricane Matthew.
Panjiva analysis shows that, adjusting for vessel capacity, the volumes handled increased 15.3% on a year earlier but were down 2.2% on a month earlier. Furthermore, bookings of neopanamax slots fell to 47.8% of the total available from 57.7% for October and 64.2% in September. This might just be a result of temporary congestion management measures, but does suggest the ‘novelty factor’ of the canal’s expansion may be wearing off.
Source: Panjiva
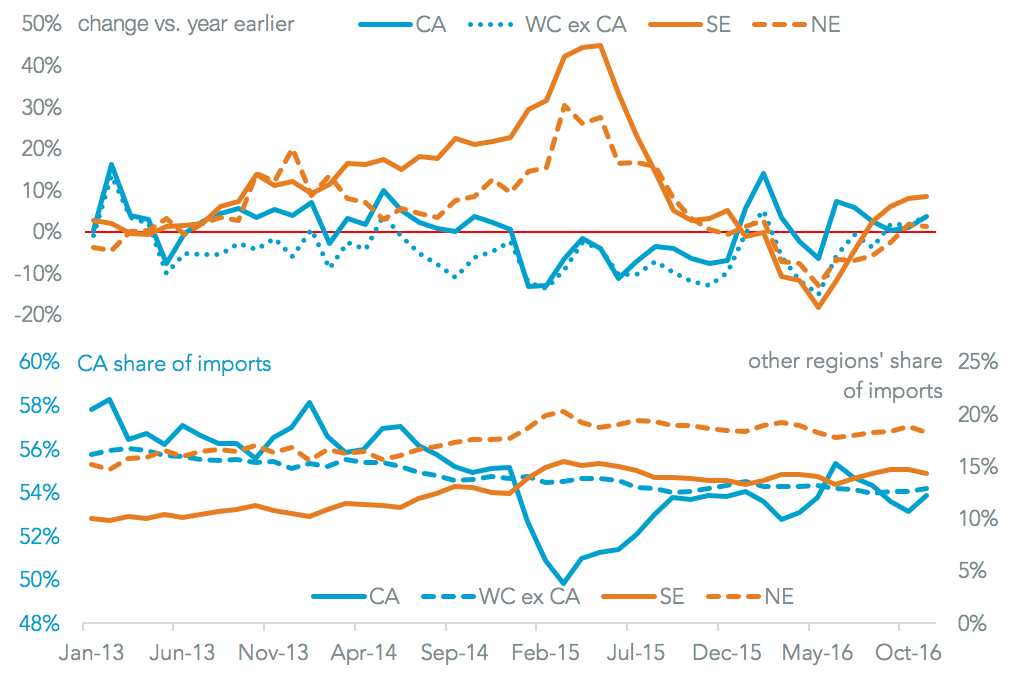
The Boston Consulting Group has previously estimated that the expansion of the canal could divert 10% of west coast U.S.-bound traffic to the east coast. There has certainly been an increase in the share of shipments to south-east coast U.S. ports, Panjiva data shows, with their share of imported shipments increasing to 14.3% in November from 13.3% in June. On the other side Californian ports’ share fell to 53.8% from 55.3%.
Yet, this may simply reflect seasonality as California’s share was actually unchanged vs. November 2016. Indeed southeast ports may only have won shipments from northeast ports, who saw a 0.41 percentage point drop in share on a year earlier. There will doubtless be further shifts in ports’ market share next year as a result of new routings by THE Alliance and Ocean as well as the final fallout from Hanjin Shipping’s restructuring and further mergers and acquisitions.
Source: Panjiva