Es
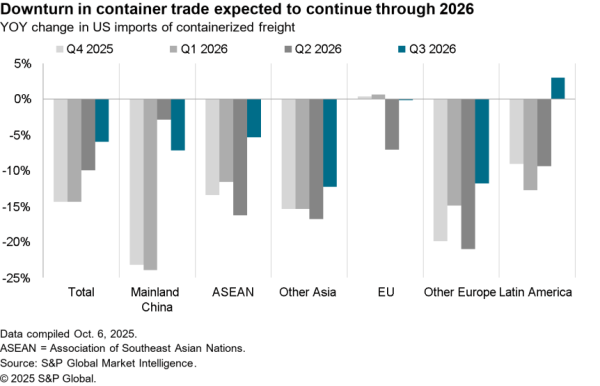
EsU.S. international import activity likely continued its long-term downturn in July, Panjiva’s data for seaborne shipping shows, with shipments having fallen by 3.9% year over year for all cargo and by 3.7% for containerized freight.
The latter was nonetheless the slowest rate of decline since January and compares to an 8.4% slide in June. The 16.0% month on month increase was also the fastest start to a peak season since at least 2007 and is indicative of a broad-based recovery in supply chains in the wake of COVID-19.

Source: Panjiva
The sudden surge in shipments may underpin some of the congestion challenges being faced at major ports, as flagged in Panjiva’s Aug. 3 report, and may not abate if the combination of peak season and recovery from COVID-19’s ravages continues.
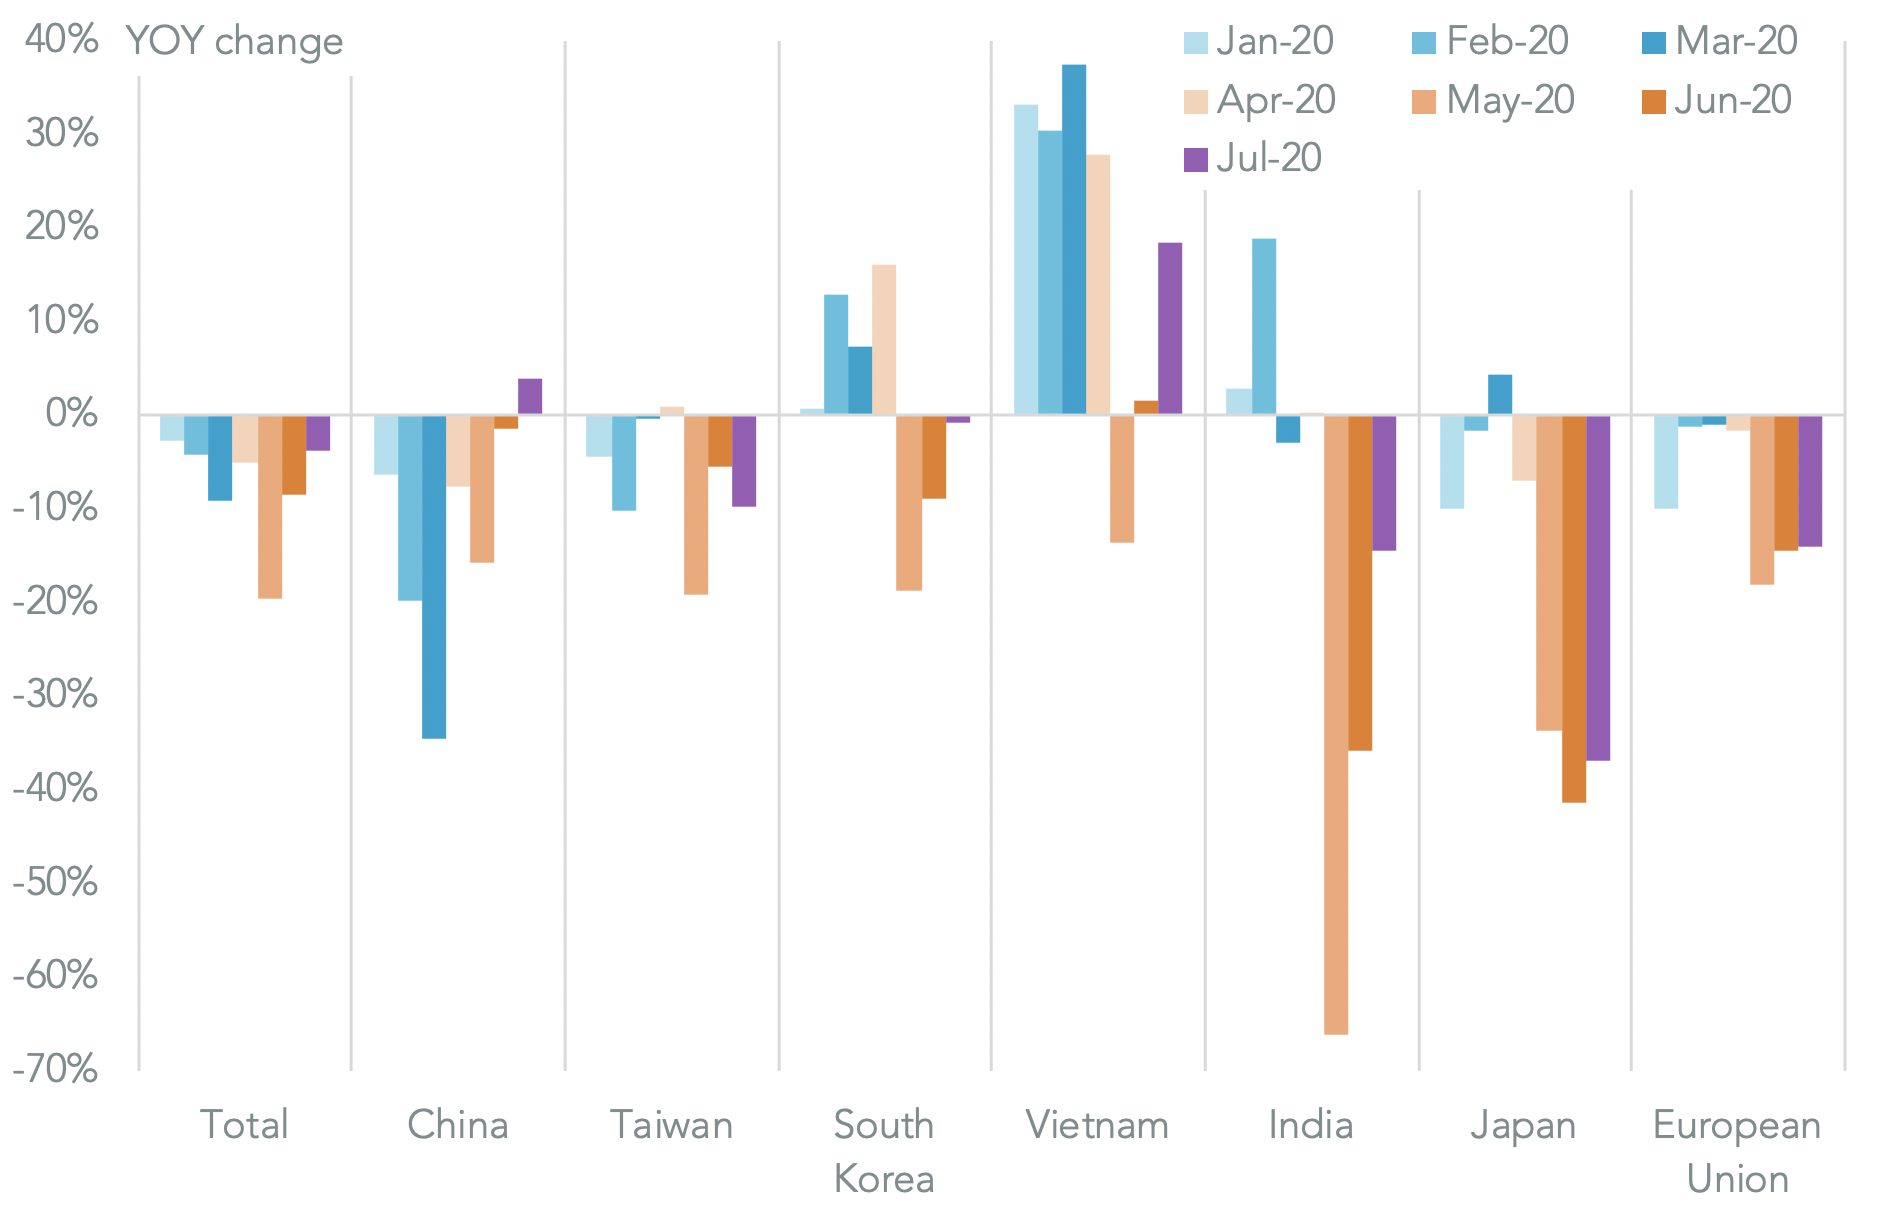
The improvement in import conditions has been largely down to an increase in imports from China of 4.0% year over year, marking the first rise on that basis since December 2018. At 1.06 million TEUs delivered it was also the largest number of deliveries for the month of July on record.
Shipments from the rest of Asia fell by just 3.2% after a 13.8% slide a month earlier thanks to improvements in trade with Singapore and Vietnam while conditions also improved in trade with South Korea and India. The fly in the ointment was trade with the EU which has continued to decline at a 14.0% rate after a 14.4% dip in June.
Source: Panjiva
As was the case in June, much of the turnaround was down to improvements in performance in the consumer discretionary and staples sectors. Imports of consumer discretionary goods fell by just 2.1% year over year after a 13.8% slide in June and a 28.2% slump in May with a 12.8% rise in imports of home furnishings and a 33.8% jump in home appliance imports indicating retailers’ confidence in renewed spending on homewares.
An earlier anticipated improvement in automotive sector shipments evaporated later in the month though the 19.1% year over year drop in imports was markedly better than June’s 32.8% slump.
Imports to fight COVID-19 continued to climb with a 48.9% increase in home / personal care (which includes PPE, hand sanitizer etc) as well as an 11.9% rise in healthcare equipment and a 16.7% increase in pharmaceutical imports.
The industrial sector continued to struggle with a 6.1% dip, potentially reflecting weak capital investment outside of agriculture. Shipments in power equipment and heavy machinery (including construction equipment and trucks) were down by 3.0% and 21.6% respectively while electrical components and building products fell by 1.3% and 7.1%.

Source: Panjiva