 Es
EsU.S. ports had another bumper month in terms of container handling in April. Panjiva data shows imports increased 8.9% on a year earlier in TEU terms. That followed a jump in imports from China and the EU, with expansion the quickest in the autos, steel and furniture segments as outlined in Panjiva research of May 8.
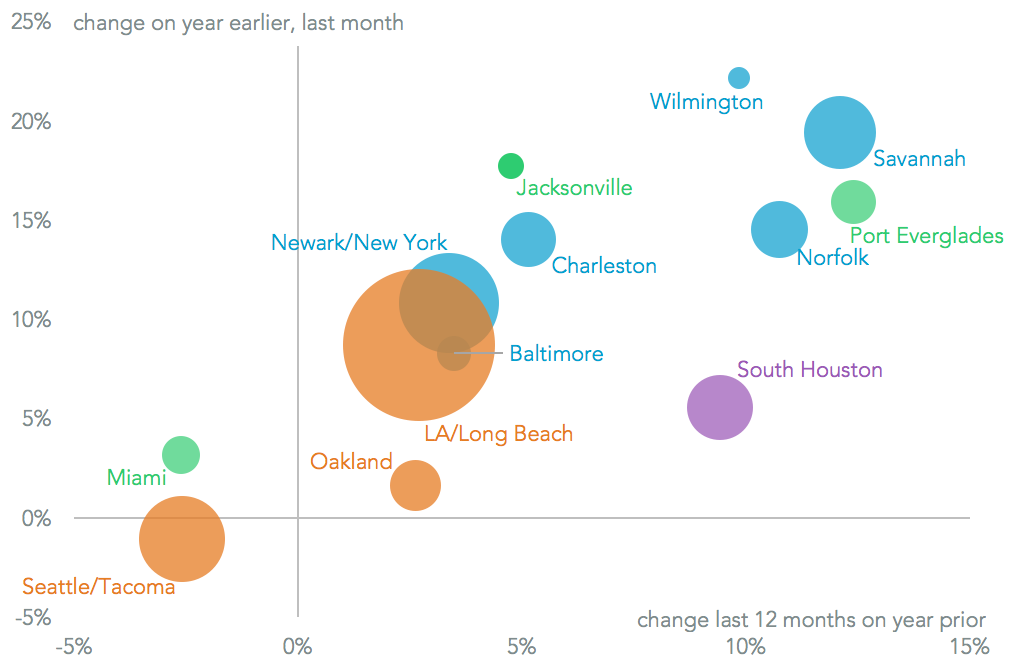
Generally speaking the east coast ports did best, with Savannah reporting 19.4% growth on a year earlier and Norfolk 14.6%. While growth in previous months has been driven in part by diversions from the west coast due to the Panama Canal extension, that process appears to have slowed.
The main losers were the Puget Sound ports of Seattle and Tacoma, which contracted by 1.0%, and New Orleans which shrunk by 21.3%. The latter does not yet appear to be benefitting from CMA-CGM’s new Brazilian service.
Source: Panjiva
The stand-out performance among the smaller ports was from Philadelphia, which saw volumes rise 105% even ahead of planned expansion investments. Among the top three ports Los Angeles lost ground after its volumes increased by 7.4% vs. 10.3% for Long Beach and 10.8% for New York. The latter will see an acceleration in its growth later in the year following the completion of the Bayonne Bridge raising project.
![]()
Source: Panjiva
The outperformance of Long Beach vs. Los Angeles for the month looks to be part of the ongoing normalization of operations following Hanjin Shipping’s demise. In the 12 months to August 31 the two ports handled similar quantities of traffic from China and Hong Kong. That dropped to Long Beach handling 70% of the volumes LA did in November, and has recovered back to 89%. A similar pattern can be seen on other Asian routes (including South Korea, Taiwan and Vietnam) though the recovery has been slower.
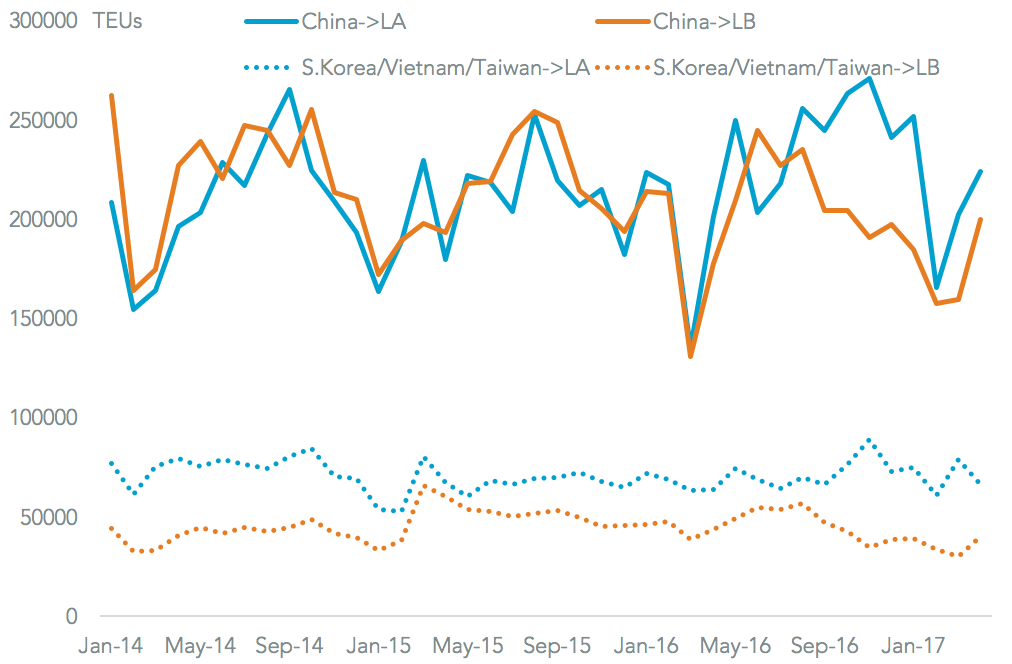
Source: Panjiva


