 Es
EsU.S. trade price deflation continued in August with headline import prices having fallen by 2.0% year over year while exports fell 1.4%, Panjiva’s analysis of official data shows. Excluding the volatile measures of energy and agriculture the import price deflation slowed for a second month to 1.1% from 1.4% while export deflation fell to 0.1% from 0.3%.

Source: Panjiva
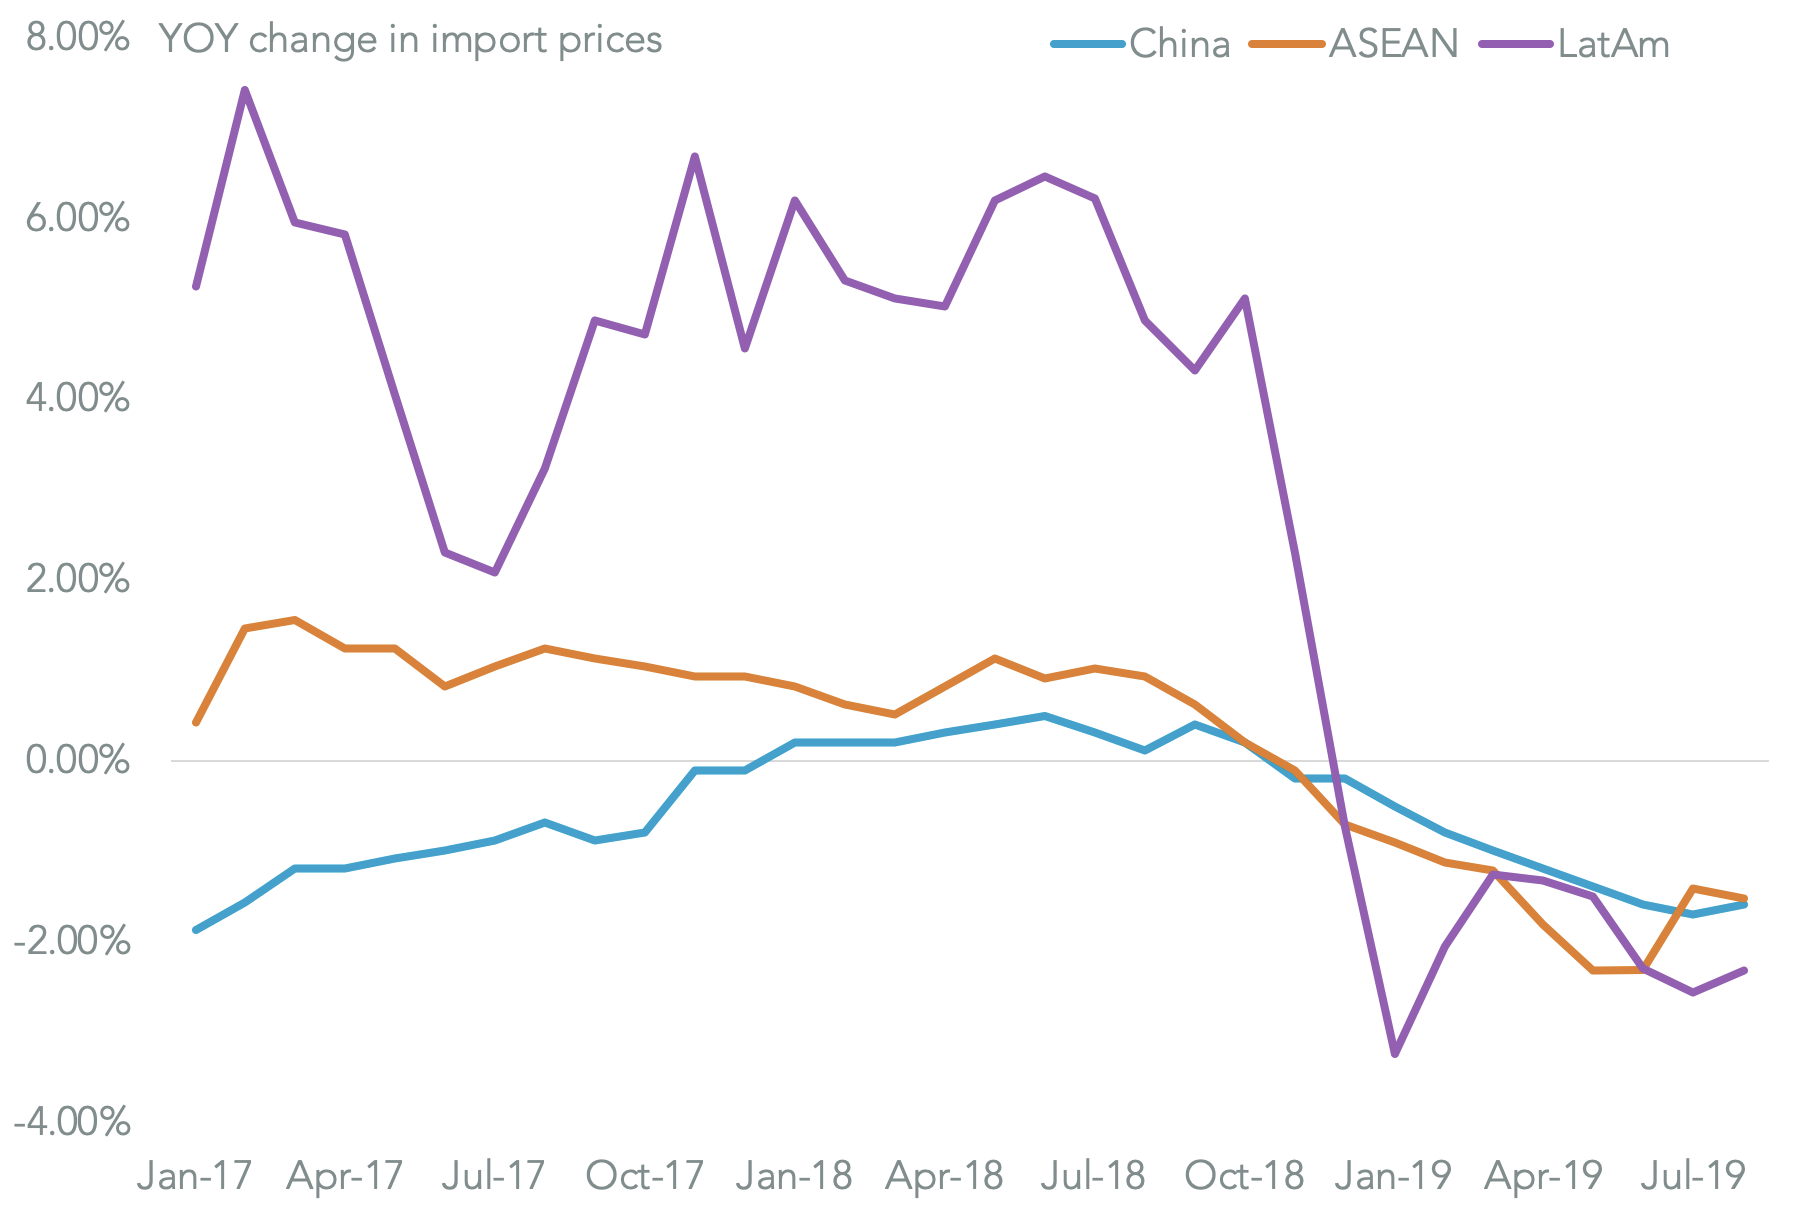
The slowing rate of deflation was widespread with the fastest rate of declining prices being seen in Latin America where there was a 2.3% drop, followed by China with a 1.6% slide. The latter was the 10th straight downturn and has largely been driven rising U.S. tariffs on Chinee exports as outlined in Panjiva’s research of Sept. 5. Tariffs are only part of the story with prices from the ASEAN region down 1.5%.
Source: Panjiva
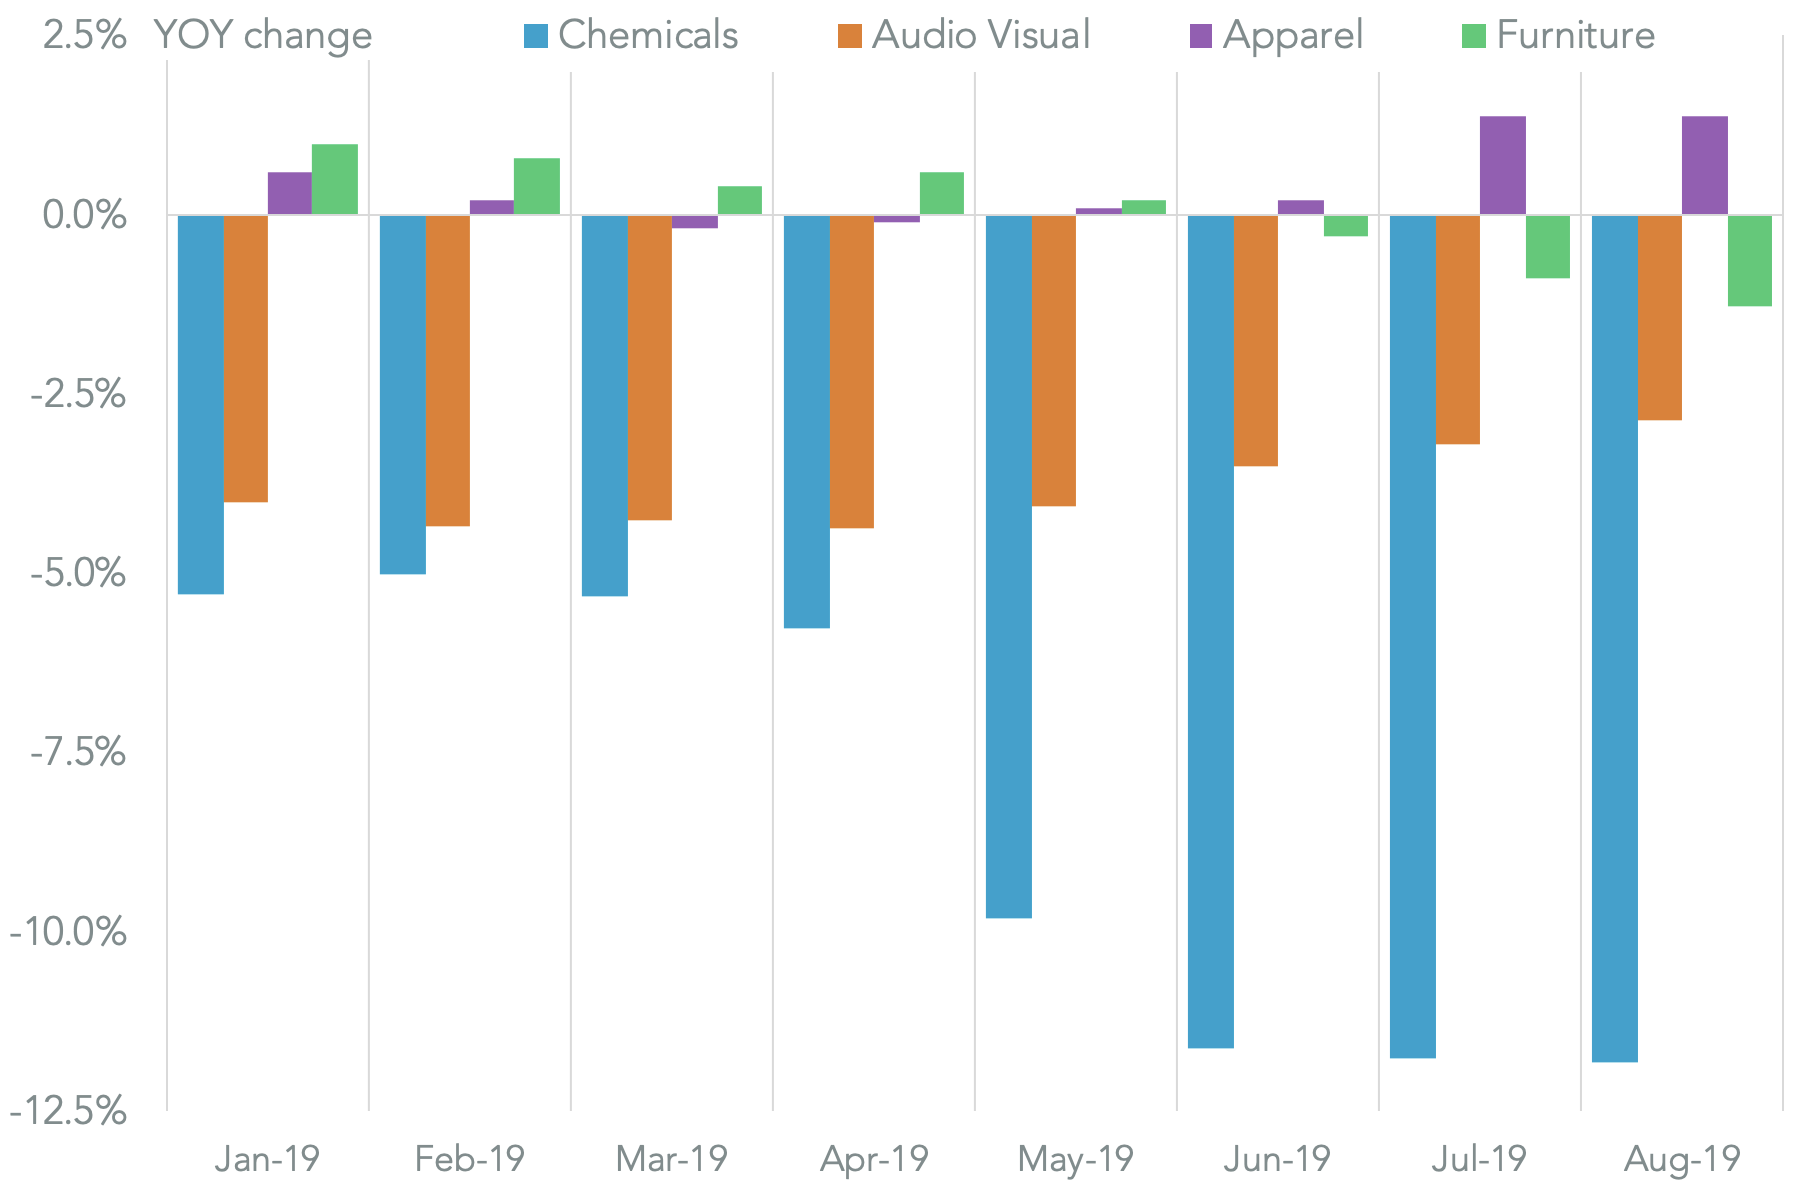
Within Chinese price deflation the fastest rate of decline was in chemicals where there was an 11.8% drop while primary manufactured products more generally fell 5.0%. A continued decline in audiovisual products of 2.9% may not be linked to tariffs given that they were only applied as part of the list 4A cluster of products on Sept. 1.
In the furniture sector, where tariffs were first applied in Sept. 2018 but were increased in May there was a third month of declines with a 1.9% slide from 0.9% the month earlier. That may be a guide to the potential for deflation in the apparel sector where duties were applied on Sept. 1. Import prices for apparel actually increased by 1.4%.
Source: Panjiva
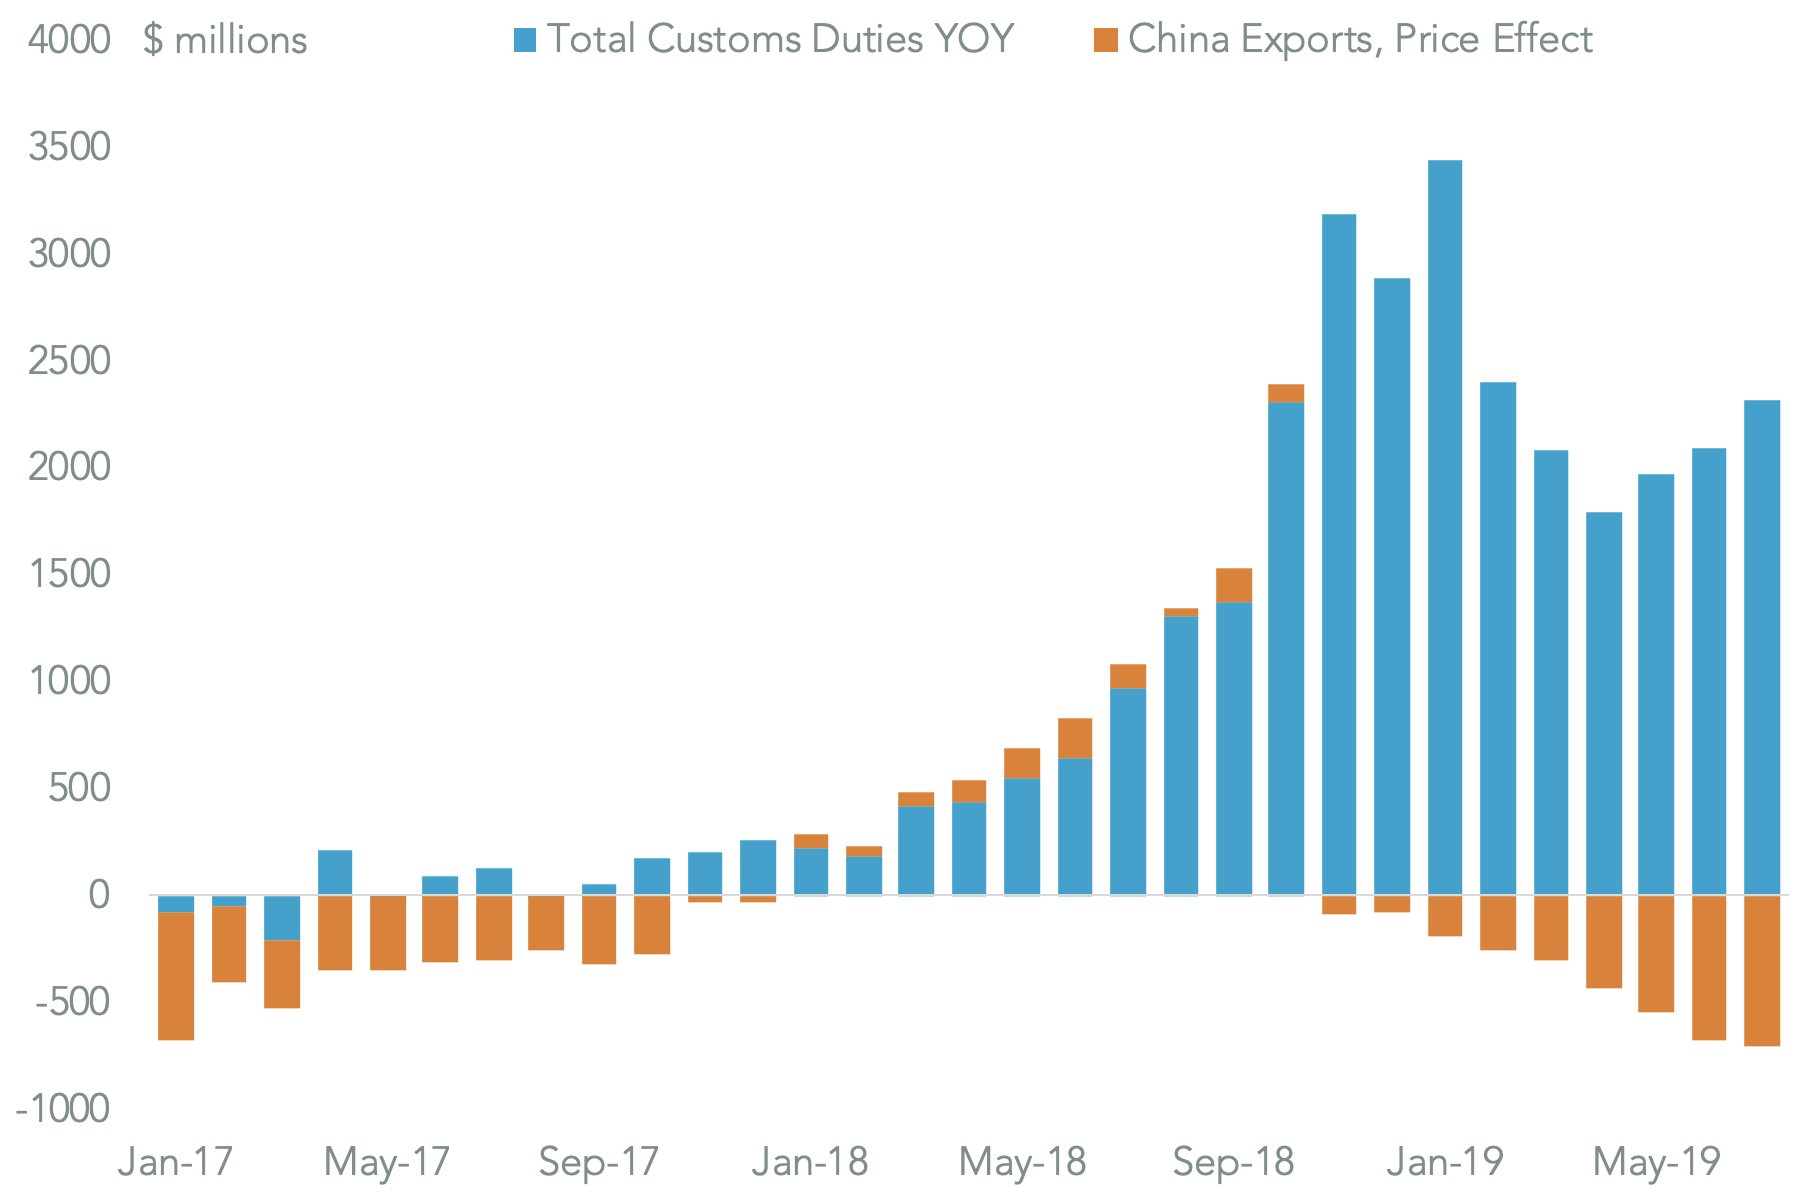
The dollar value of the Chinese price deflation – the rate multiplied by total imports from China – was equivalent to $709 million compared to a year earlier in August. That compares to a $3.27 billion increase in duties applied to Chinese imports. While an imperfect analysis that suggests 21.7% of the incremental cost of duties has been offset by price reductions. In the prior month the ratio was 18.8% suggesting increased pressure on Chinese exporters to share the burden of tariffs.
Source: Panjiva


