Es
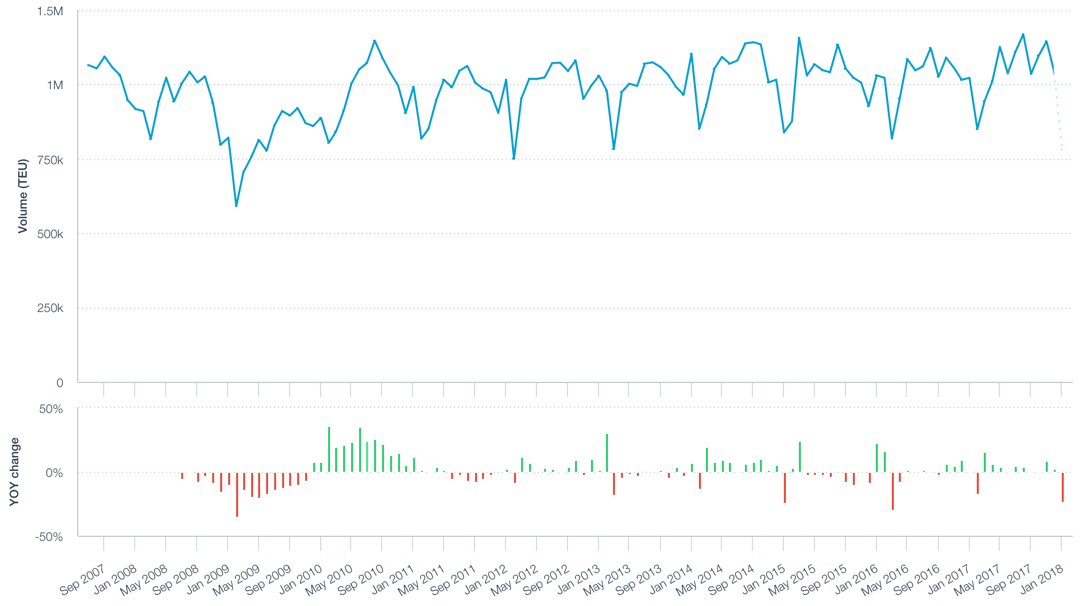
EsContainer handling at the top five west coast U.S. seaports (LA, Long Beach, Oakland, Seattle and Tacoma) climbed 6.3% on a year earlier in 2017, Panjiva analysis of official port data shows. That was led by Long Beach which gained market share in incoming Chinese traffic from neighboring Los Angeles, as outlined in Panjiva research of January 24.The Puget Sound ports only expanded by 1.6%, potentially due to a loss of market share to more northerly ports in Canada, as well as internal disruption from terminal lease changes.

Source: Panjiva
Unlike the rest of the country, as shown by the expanding trade deficit, the volume of incoming traffic to the west coast lagged incoming traffic. Panjiva data shows seaborne imports to the western U.S. (ports in California, Oregon and Washington state) climbed by just 2.1% on a year earlier to reach 12.59 million TEUs, inline with the level seen in 2014. That may indicate the length of disruption to trading patterns resulting from the strikes of early 2015.
Source: Panjiva
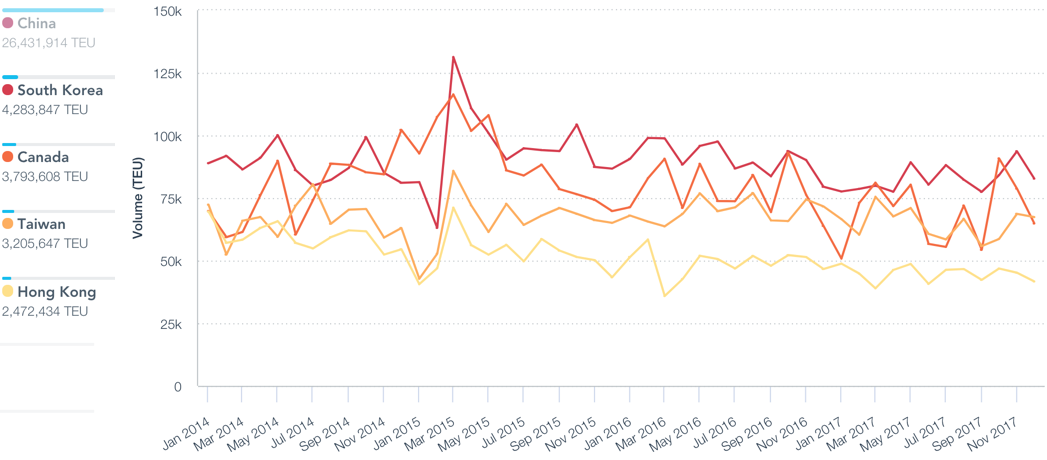
That’s largely explained by a slowdown in traffic from southeast Asia, in particular South Korea (9.8% lower) and Taiwan (down 7.3%) as well as a drop in shipments from Canada (11.6%). There was also a loss of market share in shipments from China (which improved by 5.4%) as a result of services delivering directly to the east coast via the Panama Canal. The Canal saw a 30% rise in volumes handled in the year as a result of a full 12 months of operation of the widened facilities.
Source: Panjiva
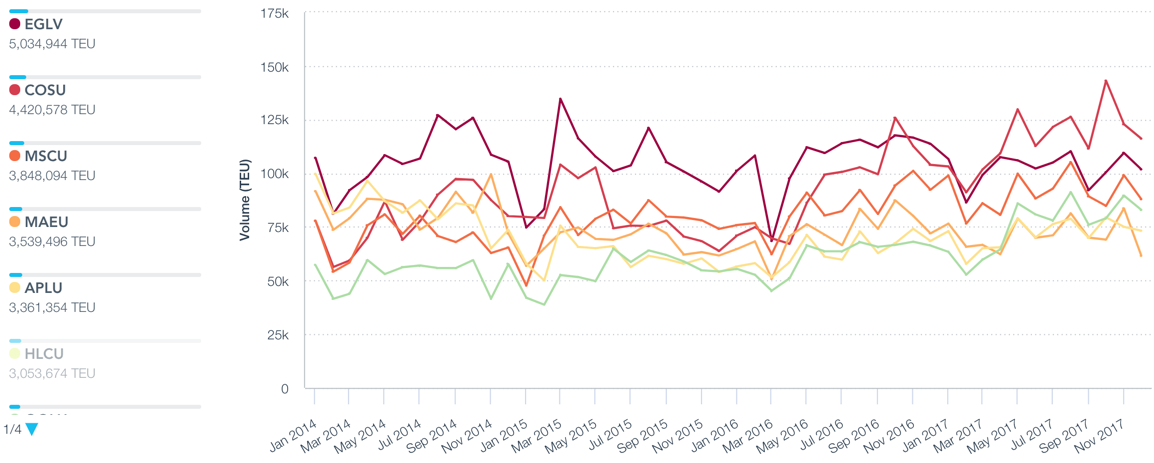
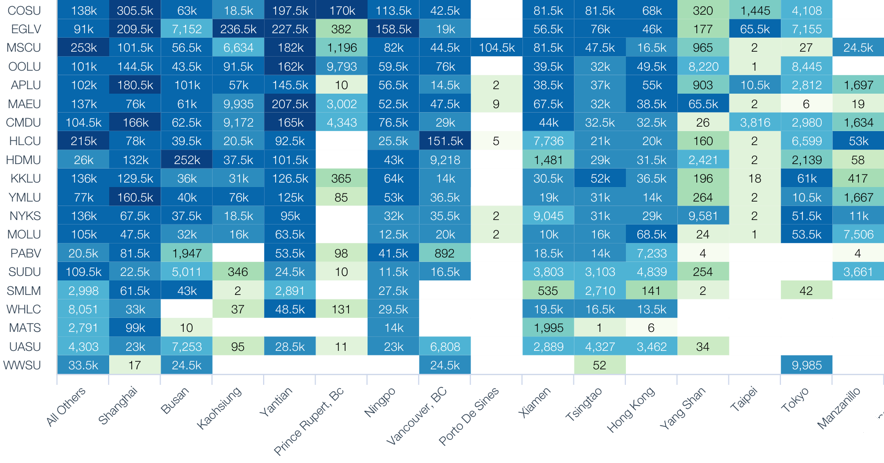
CMA-CGM’s integration of APL resulted in it retaining its number one container-line position on all routes into the west coast, including a 13.8% rise in handling to reach 1.64 million TEUs. That put it ahead of COSCO Shipping which surged 24.7% higher (including CSCL) to reach 1.39 million TEUs and in turn overtake Evergreen as the second shipper. COSCO will become the largest shipper once it is integrated with Orient Overseas with a combined 2.29 million TEUs handled. Orient Overseas also expanded rapidly with a 23.4% rise moving it to fifth place from seventh.
Source: Panjiva
The most significant service was COSCO’s shipments from Shanghai with an aggregate 305,500 TEUs handled, which was 1.2x the next biggest – Hyundai Merchant Marine’s 252,000 TEUs from Busan. The largest non-Asian services include COSCO’s from Prince Rupert, Hapag-Lloyd from Vancouver and MSC from Sines.
Source: Panjiva