 Es
EsThe start of the global financial crash in 2007 was marked by the suspension of trading in three mortgage-backed funds by BNP Paribas on August 9, according to The Economist. The crash had a fundamental impact on world trade including: reducing volumes of trade; drastically cutting trade and shipping finance; forcing shipping companies to rethink their corporate strategies; and reshaping global supply chains.
A decade on though international trade is in rude health, including U.S. inbound traffic which breached 1 million shipments for a second time in July, as outlined in Panjiva research of August 7. In five charts, here’s how the shipping landscape has changed in July 2017 vs. July 2007 (the last month before the crash):
Chart 1 – China Gains in Importance, Vietnam Becomes the New Japan
Panjiva data shows the mix of imports to the U.S. has changed radically. China remains the biggest supplier, with more direct shipments from the mainland. Vietnam has emerged as a major manufacturing hub (number 7 from 17), displacing Japan (9 down from 4) as Chinese companies relocate in favor of lower labor costs and – to a lesser extent – more favorable tariff regimes.
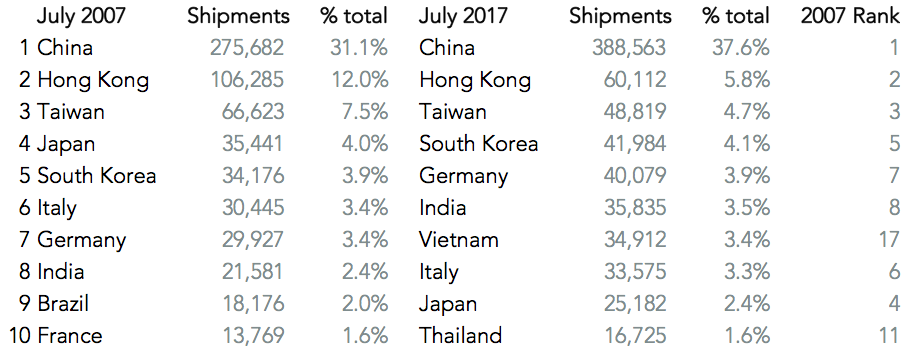
Source: Panjiva
Chart 2 – America Making More with Components
The political landscape in 2017 is dominated by discussion of the loss of American manufacturing. Yet, the biggest gains in the share of products shipped has come from car parts (HS 8708) and paints / pigments (HS 3206). Meanwhile, imports of apparel (6110) have become less important – partly reflecting the emergence of the importance of e-commerce as well as changing consumer habits.
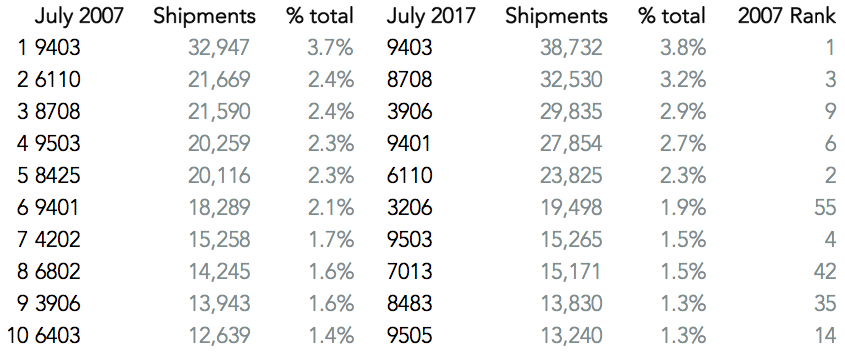
Source: Panjiva
Chart 3 – The rise of MSC at Sea
The container-line industry has changed significantly, with the rise of MSC, CMA-CGM (including its takeover of APLU) and COSCO Shipping into the top ranks. Consolidation, which has been a theme recently with takeovers of Hamburg Sud and Orient Overseas, and the three-way merger of the Japanese lines, has actually fallen. The top 10 shippers had a 36.6% share in July 2017, down from 37.8% in July 2007.
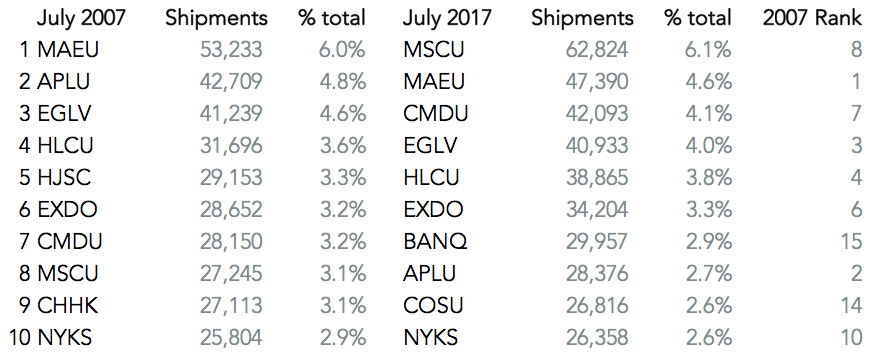
Source: Panjiva
Chart 4 – Radical change among forwarders
The most changed landscape in the past decade has been among the NVOCCs. That has partly reflected a process of consolidation, but includes operators exiting the market. The rise of Christal, and arrival of DB Schenker and Panalpina in their current forms have been remarkable. The industry is still fragmented, but the top 10 now account for 13.1% of shipments from 9.9% a decade ago.
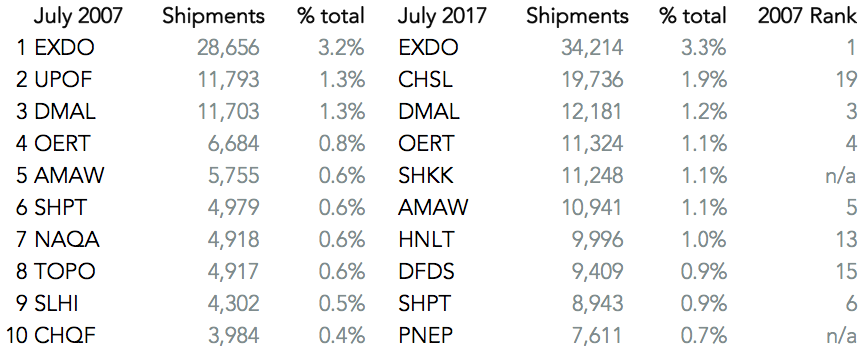
Source: Panjiva
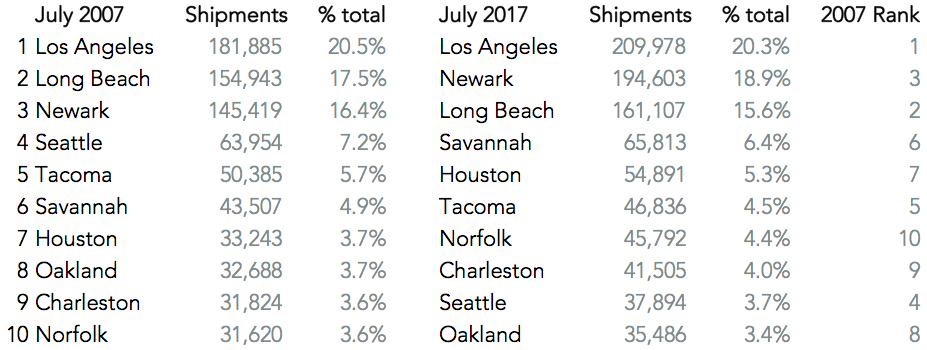
Chart 5 – East Overtakes West in Ports
Ports can’t go anywhere, but their relative importance can certainly shift. That reflects a mixture of local economy (new factories for example) and global infrastructure (larger vessels, the Panama Canal widening) driving different rates of growth. Newark overtook Long Beach as the second largest port – though they vie month-to-month for that honor. Savannah, Houston and Norfolk show the impact of the Panama Canal, while Seattle and Tacoma’s decline indicate a slowdown in the regional economy.
Source: Panjiva


