 Es
EsTrade policy action from the administration of President Donald Trump shook up supply chains strategies in April and made up the bulk of the most read Panjiva research in April. Threats from the President to close the Mexican border raised the prospect of disruptions to food and electronics supply chains. Threats, and counter-threats, of tariffs in the aerospace industry run the risk of scuppering U.S.-EU trade talks before they even being. The removal of waivers for purchases of Iranian oil could have a blow-back effect for U.S. oil importers. Six months after the implementation of tariffs by China and the U.S. it is far from clear whether either party can be said to be winning the trade war.
#1 Lessons from six months of trade war (Apr. 9)
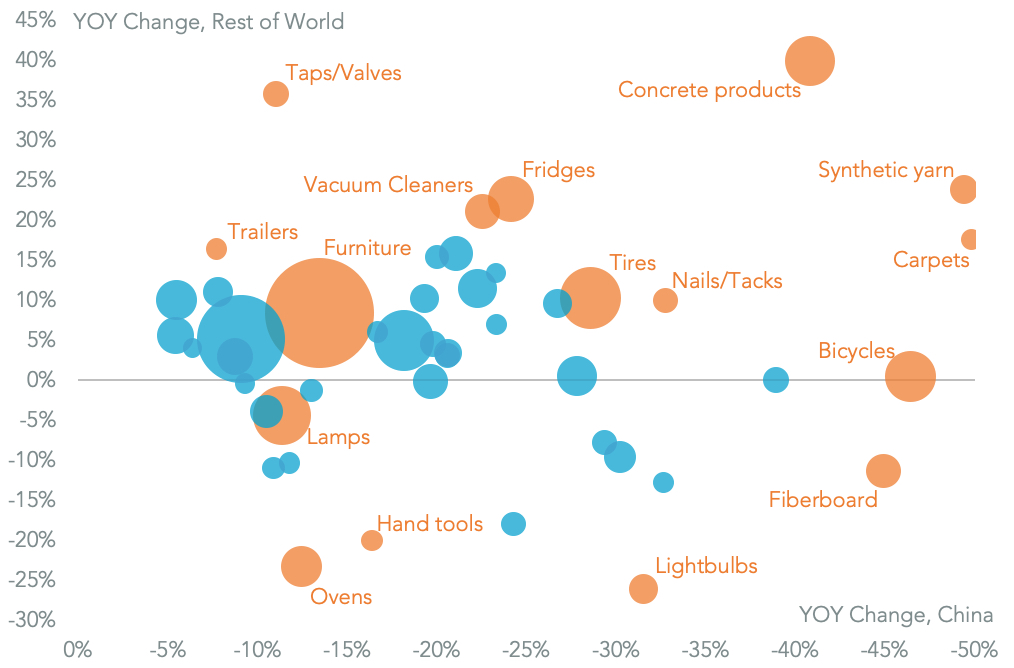
After six months of U.S. tariffs applied to $250 billion of Chinese exports there are clear signs of supply chain restructuring among U.S. seaborne imports of products afflicted by duties. Imports by sea from China have fallen by 6.4% year over year in 1Q 2019. In the tire sector imports from China have fallen by 28.6% and have led Cooper Tire to write down recently acquired assets. Those have been largely replaced by shipments from Vietnam and South Korea by Hankook and Nexen.
Imports of furniture from China fell 13.5% – partly as importers including Ikea and Home Depot have worked through excess inventories – and have been offset in part by a 37.2% rise in shipments from Vietnam. For refrigerators there’s been an aggressive supply chain restructuring away from China and towards South Korea and Mexico, imports from which rose 31.8% and 32.0% respectively, by Samsung Electronics and LG Electronics.
A wider trade complaint by Whirlpool, as was the case for washing machines, is unlikely given it has increased imports from Mexico. The most stark shift though can be seen in vacuum cleaners where imports from China fell 22.5% and have been replaced by Dyson’s shipments from Malaysia and Shop-Vac’s imports from Vietnam.
Source: Panjiva
#2 Trump’s border threat raises the stakes for food (Apr. 1)
President Donald Trump has threatened to close the border with Mexico “this week” which potentially “could be to all trade” as a response to continued migrant flows across the border. Truck-borne bilateral trade between the U.S. and Mexico reached $484.4 billion in the 12 months to Feb. 28, or 64.5% of all trade between the two countries. Mexico’s exports are more exposed – trucking represented 70.7% of the total – with shipments of perishable goods and just-in-time manufacturing process products at the most risk.
Mexican exports of agricultural products were worth $13.50 billion in the past 12 months and had increased by just 0.5% year over year in the past 12 months. That was led by a 4.1% decline in shipments of fruit worth $6.47 billion despite a recovery in the past three months. Leading food exporters that are exposed to the border closure include Driscoll Foods with $1.44 billion of fruit shipments, meat-packer Grupo Viz with $678 million as well as shipments by Mission Produce, Del Monte and Taylor Fresh Foods.

Source: Panjiva
( Panjiva Research – Food & Beverages)
#3 Trump’s jet leverage attempt could crash EU talks (Apr. 9)
The administration of President Donald Trump, via the U.S. Trade Representative, has announced a list of 326 import lines from the EU which it may apply tariffs to in retaliation for EU subsidies provided to Airbus. The review, under the section 301 process, will likely run for several months and could easily jeopardize nascent EU-U.S. trade talks. The latter are contingent on neither side applying new tariffs during the period that negotiations are underway.
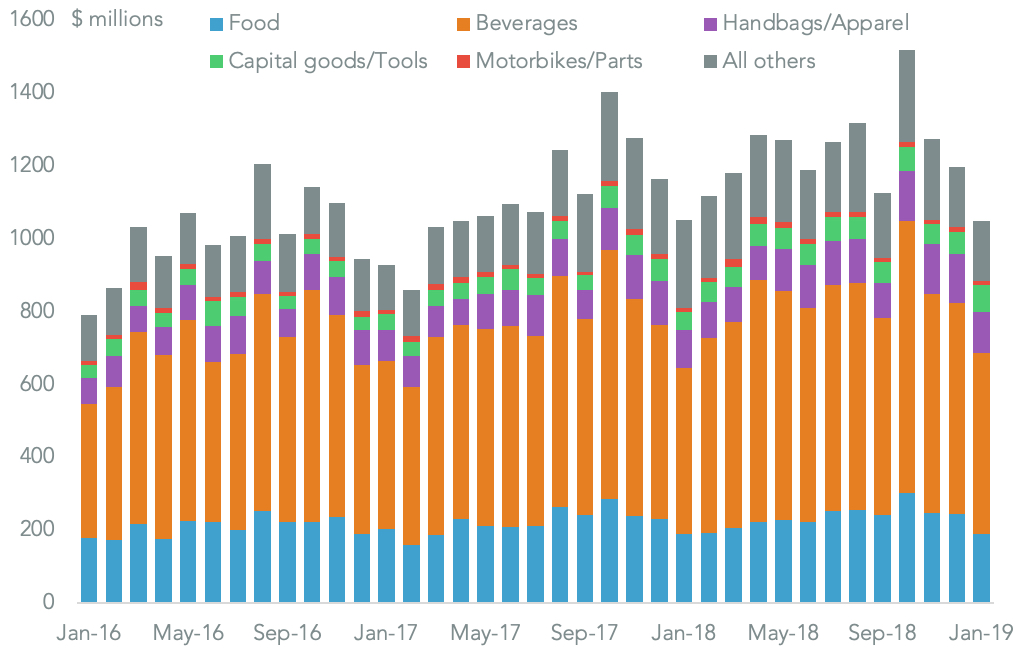
Panjiva analysis shows the initial list accounted for $23.8 billion of U.S. imports from the EU in 2018, requiring an average 47.0% tariff rate to achieve the required $11.2 billion of retaliation. Aerospace products accounted for $9.03 billion of the imports, while food and beverages represented $2.81 billion and $7.14 billion respectively. Other products targeted include apparel, tools and motorbikes.
Notably most of the targets are in the consumer space, though the appeals process – and likely EU counter-relation – will raise risks for industrial supply chains in the run-up to a decision on the final tariff list.
( Panjiva Research – Aerospace)
Source: Panjiva
#4 Traveling without moving – 2Q 2019 Outlook (Mar. 21)
A slowdown in global trade is being accompanied by glacial progress in six of the major trade negotiations identified in Panjiva’s 2019 Outlook. (1) Brexit remains in limbo until a third British parliamentary vote due next week. The no-deal deadline for leaving the EU has effectively been moved to April 12. The autos and apparel sectors are most exposed to any increases in tariffs applied by the EU. (2) Ratification of the U.S.-Mexico-Canada Agreement appears unlikely before the summer. It is being held up in part by U.S. steel duties that have failed to prevent a 10.1% year over year rise in Mexican exports in January.
(3) A U.S.-China trade deal looks less likely after President Donald Trump threatened to leave tariffs in place until China has proven it will deliver on its commitments. Meanwhile the outcome of the trade war in terms of net exports finally turned in America’s favor in February. (4) U.S. trade deals with both the EU and Japan are making slow progress. In the EU’s case there are seemingly intractable differences on the inclusion of agriculture. President Trump’s threats to apply section 232 automotive duties – where a decision is due May 17 – is a potent lever given EU auto exports are 6.5x U.S. exports.
(5) The U.S. negotiations with Japan there’s the added complication of a section 232 review of titanium sponge. Japan supplies 93% of U.S. imports and may be declared a national security risk. 6) The RCEP trade deal in Asia – including China, India, Japan and South Korea among others – is unlikely to make much progress until year end. That’s despite slowing trade in most Asian countries, including a 4.7% year over year drop in Chinese exports in the first two months of 2019, an 8.3% slide in South Korea and a 5.3% drop in Japan.

Source: Panjiva
#5 Valero faces knock-on from Iran waiver removal (Apr. 22)
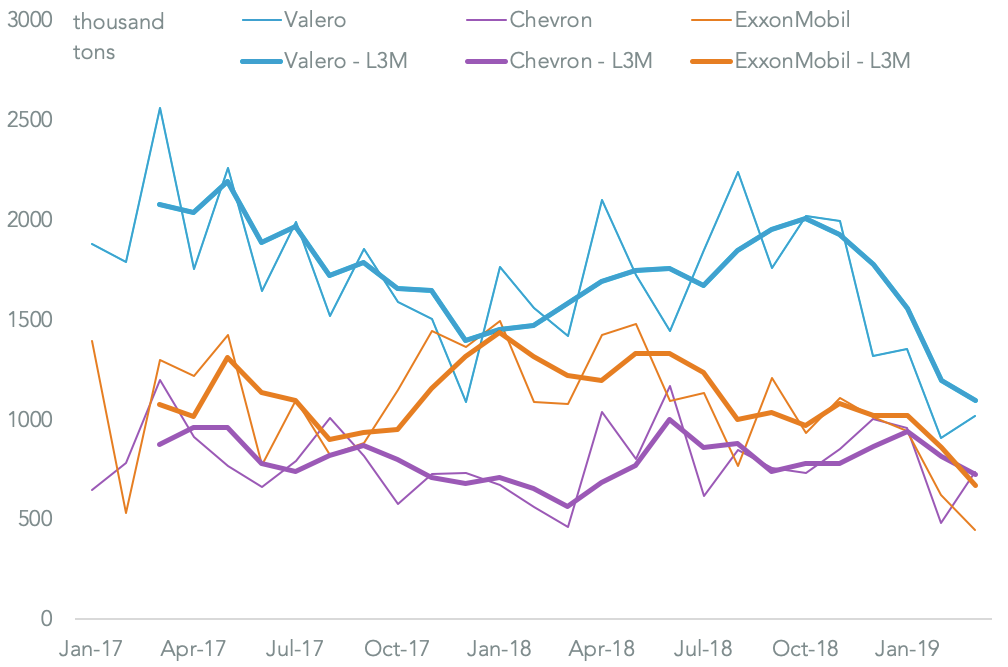
The U.S. State Department has terminated waivers for relief from sanctions against Iranian oil exports. That may prove a challenge for buyers in India – including Indian Oil and Mangalore Refining – as well as China, Japan, South Korea and Turkey should non-dollar payment mechanisms prove ineffective. Crude oil prices have climbed as a result, partly putting President Donald Trump’s objective of keeping fuel prices down at risk. U.S. energy independence is improving with exports having reached a record 83.7 mboe in February.
Yet, they still only represent 56.5% of imports. The waiver leaves U.S. importers facing increased competition and higher costs for global oil volumes. The leading U.S. importer from outside North America in the 12 months to Mar. 31 was Valero with 12.5% of the total, followed by ExxonMobil and Chevron.
Source: Panjiva
#6 DSV dominates forwarder growth (Apr. 10)
Freight forwarders operating services into the U.S. by sea saw a 6.7% growth in shipments in March as lower imports from China were replaced by volumes shipped from other Asian markets. The weakest performers among the top 10 forwarders included UPS – which saw a 14.5% drop in shipments – Kerry and CH Robinson as a result of their higher-than-average exposure to China.
DSV did best with a 26.4% surge in traffic in March, which came at the same time as it sought to complete its takeover of Panalpina. Shipments from Europe by DSV jumped 82.6% year over year in March, illustrating the importance management associate with scale. The increase in DSV’s business was helped by a jump in imports by wind-turbine maker Vestas, luxury goods maker Estee Lauder and by automaker Ferrari via its Maserati brand.
( Panjiva Research – Logistics)

Source: Panjiva
#7 K+N volumes and margins up, UPS down (Apr. 25)
K+N and UPS provided a study in contrasts in their 1Q results. K+N’s revenues increased by 7.7% year over year including a 6.2% improvement in ocean freight volumes. UPS meanwhile saw growth of just 0.3% – the lowest since 3Q 2015 – including a 3.9% drop in international supply chain revenues. K+N has been selective in where it has built market share, indeed its U.S. seaborne import volumes fell 1.1%.
It nonetheless outstripped UPS, which saw an 18.1% drop due to its exposure to China. K+N’s profitability has improved with an EBITDA margin of 8.0% being the highest since at least 2013, helped by cost cutting and a better result from contract logistics. It may be able to grow its business further with the recently announced K+N Pledge product. UPS meanwhile saw its EBITDA margin drop to the lowest since at least 2013 after incurring weather-related costs in the U.S. on top of its drop in volumes.
( Panjiva Research – Logistics)

Source: Panjiva
#8 China’s PC industry bears the brunt of trade defeat (Mar. 28)
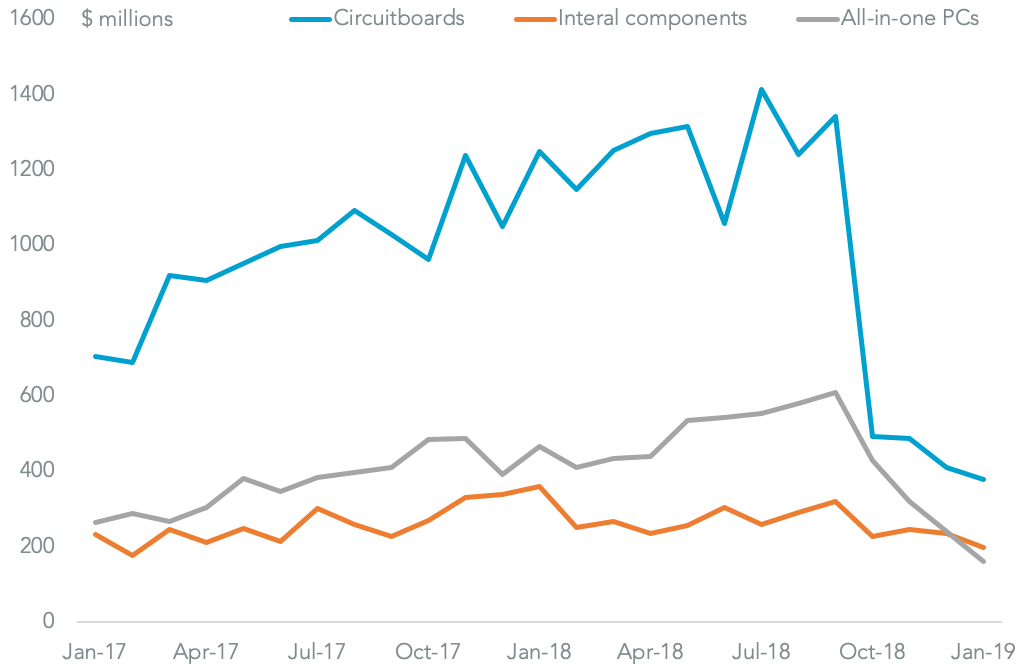
China has begun to lose the trade war with the U.S. on the basis of the balance of exports between the two countries. Looking at products where section 301 tariffs were applied in three phases from July to September China’s exports to the U.S. fell 19.5% year over year in January. That was equivalent to a $4.40 billion decline and was driven by the first decline in list three product shipments since tariffs were applied in September.
The PC industry generated the largest reductions in dollar terms with PC circuit board exports to the U.S. having fallen 69.7%, while other internal PC components dropped 45.3% and all-in-one PC systems slumped 65.2%. U.S. exports to China subject to tariffs fell by a faster rate of 29.2% but by just $2.29 billion in dollar terms. While that meant China felt a bigger net impact from tariffs than the U.S. – i.e. $4.40 billion versus $2.29 billion – in the month of January, the balance since July in aggregate is still firmly in China’s “favor” to the tune of $13.2 billion.
( Panjiva Research – Tech. Hardware)
Source: Panjiva
#9 Deere pays the price as EU retaliates early (Apr. 17)
The European Commission has launched a consultation through May 31 into potential retaliatory duties against U.S. aerospace subsidies. While that’s part of a WTO process it comes at the same time as the U.S. has launched a section 301 review of duties to be applied in retaliation for EU aerospace subsidies. Both reviews put forthcoming, wide-ranging trade negotiations at risk. The most significant product being targeted by the EU are bituminous coal, where U.S. exports were worth $4.0 billion in 2018.
That’s followed by a wide-range of chemicals worth $3.37 billion and food/beverages valued at over $2.1 billion. Outside commodities there are several capital equipment targets worth an aggregate $1.65 billion. Those include construction machinery, such as those exported by Deere & Co, industrial engines exported by Cummins and even motorcycle parts shipped by Harley Davidson.
( Panjiva Research – Capital Goods)

Source: Panjiva
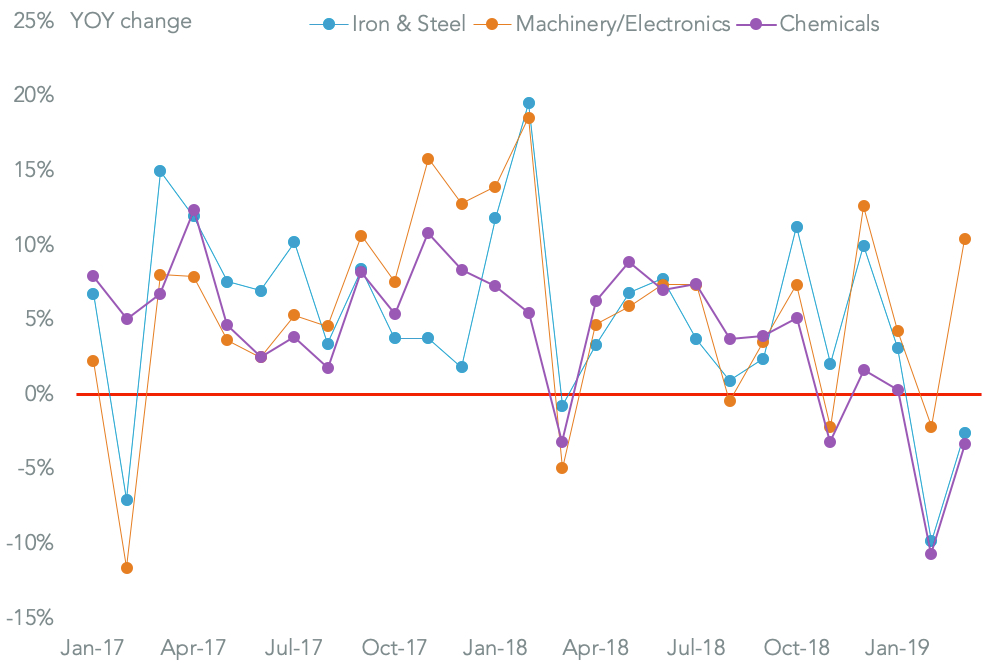
#10 The remarkable resilience of America’s demand (Apr. 8)
U.S. seaborne imports returned to growth in March with a 6.7% year over year expansion following a 4.1% drop in February. The improvement came despite a 3.9% drop in imports from China, which likely reflects the effective implementation of U.S. tariffs. That’s been offset by a 17.8% surge in shipments from other Asian markets including Vietnam, India and Thailand, suggesting importers may be actively switching their sourcing strategies.
Industrial demand for investment products was stronger than that for raw materials with imports of machinery and electrical goods up 10.4% while chemicals fell 3.3%. Looking ahead a resolution of U.S.-China trade talks will be the main driver of the pattern of trade. The level of activity meanwhile may be subject to declining industrial sentiment and a wider global slowdown in international trade.
( Panjiva Research – Economics)
Source: Panjiva


