 Es
EsThe U.K. is no closer to a Brexit deal after the past weekend’s Parliamentary votes. While Prime Minister Johnson has completed the required request for an extension the Financial Times reports, there are at least two more Parliamentary votes to be completed. It is by no means clear that the EU will approve the U.K.’s request – as outlined in Panjiva’s 4Q Outlook there is no formal deadline other than the practical one of Oct. 31 for it to do so.
While much of the focus has been on the impact of Brexit on the U.K. it is also worth noting that the disruptions from business uncertainty couldn’t come at a worse time. The outbound exports from the EU dropped 3.3% year over year in August, Panjiva’s analysis of official data.
That may mark an inflection point from a 6.5% surge in July and a 5.3% improvement in the second quarter. While the U.K. provided a drag in August, even excluding the U.K. there was a 1.5% drop in exports from the EU in August, including a 4.9% slump in exports from Germany and 5.5% from the Netherlands.

Source: Panjiva
Clearly not all member states will care about an extension or be supportive of creating a generous trade deal for the U.K. post Brexit. On average the UK accounted for 6.2% of total EU exports (both within and outside EU) across the region in the 12 months to Aug. 31.
Unsurprisingly Ireland was the most exposed with 11.1% of exports heading to the U.K. That was followed by the Netherlands with 8.3% and Belgium with 7.7%.
Among the other major EU states Spain was the fourth most exposed to the U.K. with 6.9% of exports followed by France at 6.8%. Germany was only ninth at 6.0%, though it has suffered a 5.1% downturn in exports to the U,.K. in the past 12 months and it was the largest exporter to the U.K. in absolute terms with 79.3 billion euros ($88.4 billion) of exports over the past 12 months.

Source: Panjiva
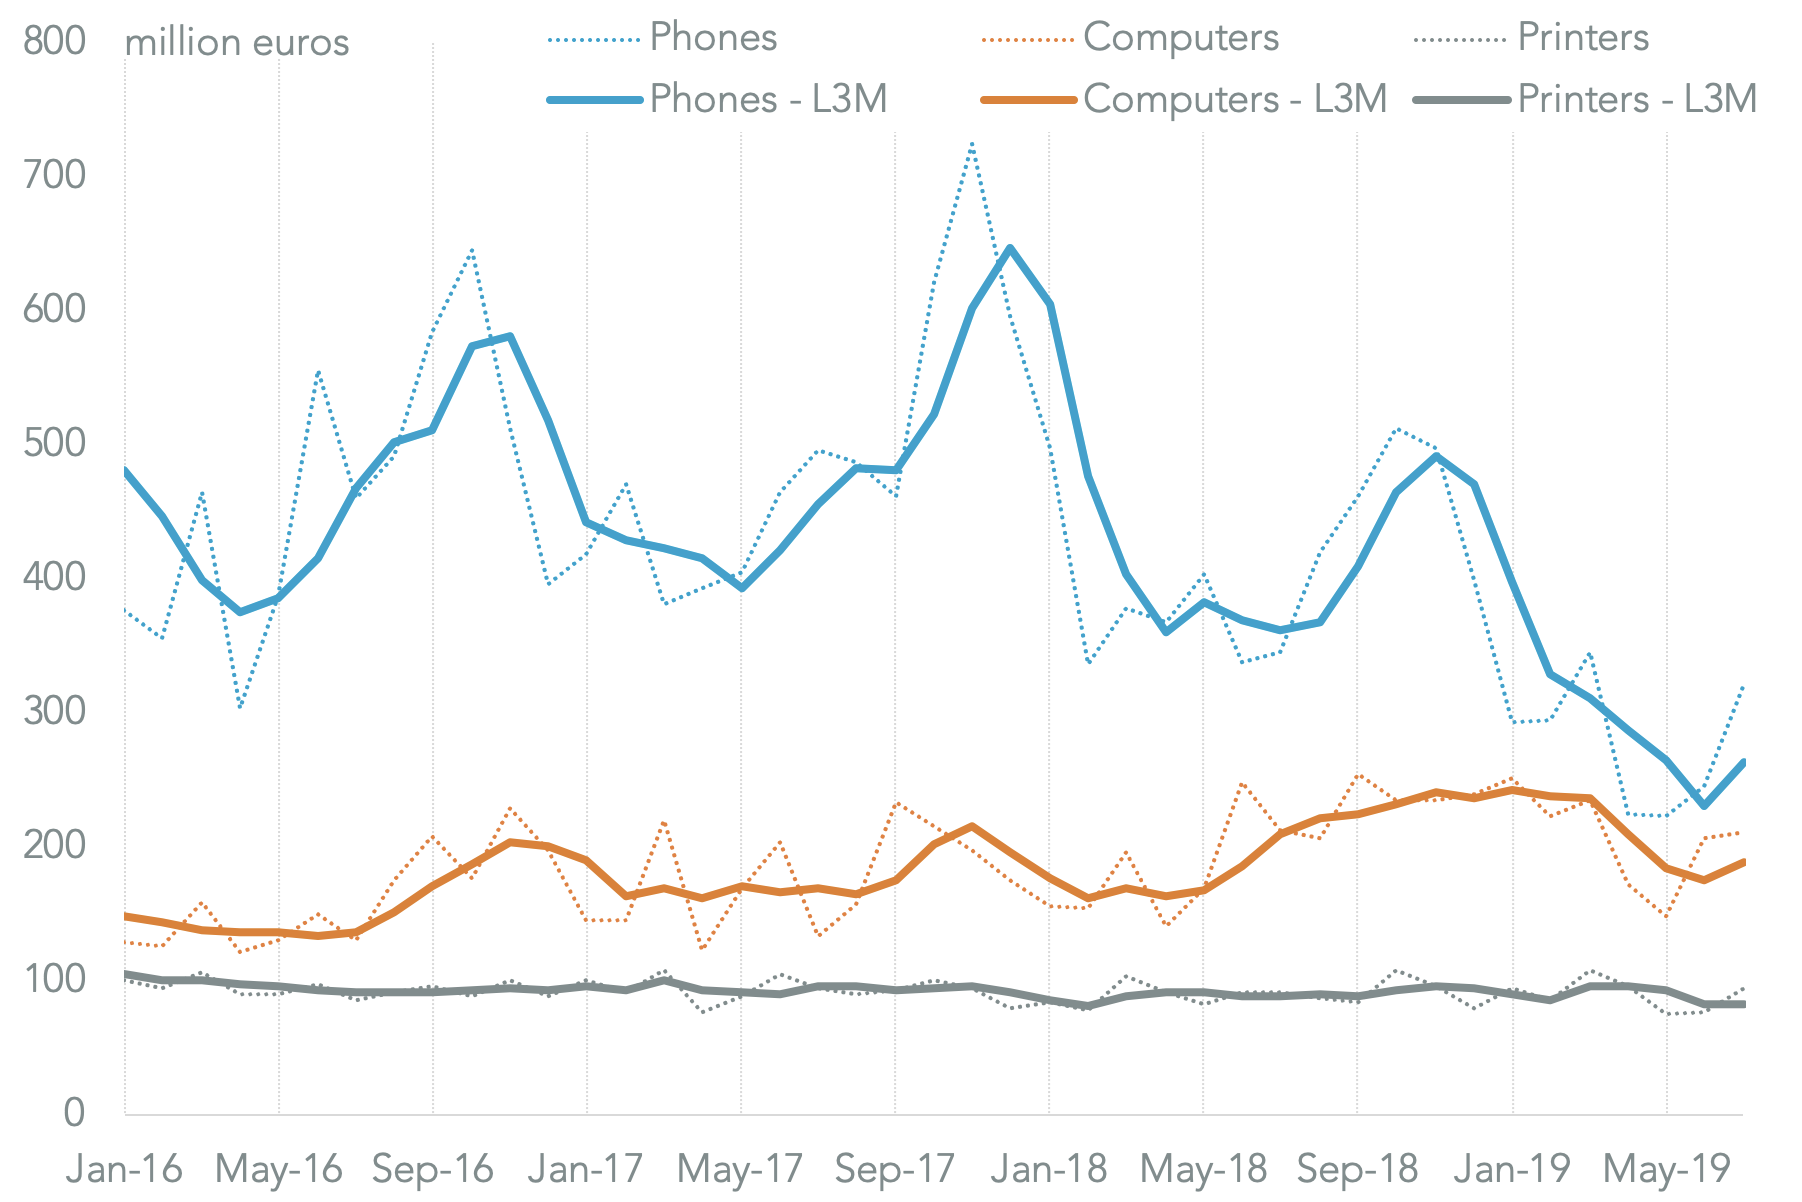
Brexit could have marked impact on electronics supply chains. The leading exported products from the Netherlands to the U.K. in the 12 months to Aug. 31 included phones with 4.24 billion euros exported, representing 8.2% of the total following a 23.7% drop.That was followed by computers with 2.62 billion euros shipped representing 5.0% of the total after a 16.1% improvement. Printers meanwhile represented 1.09 billion euros of exports after a 0.2% improvement.
There may be opportunities to mitigate the risks from Brexit by shipping direct from Asian manufacturers to the U.K. rather than shipping via the Netherlands.
Source: Panjiva
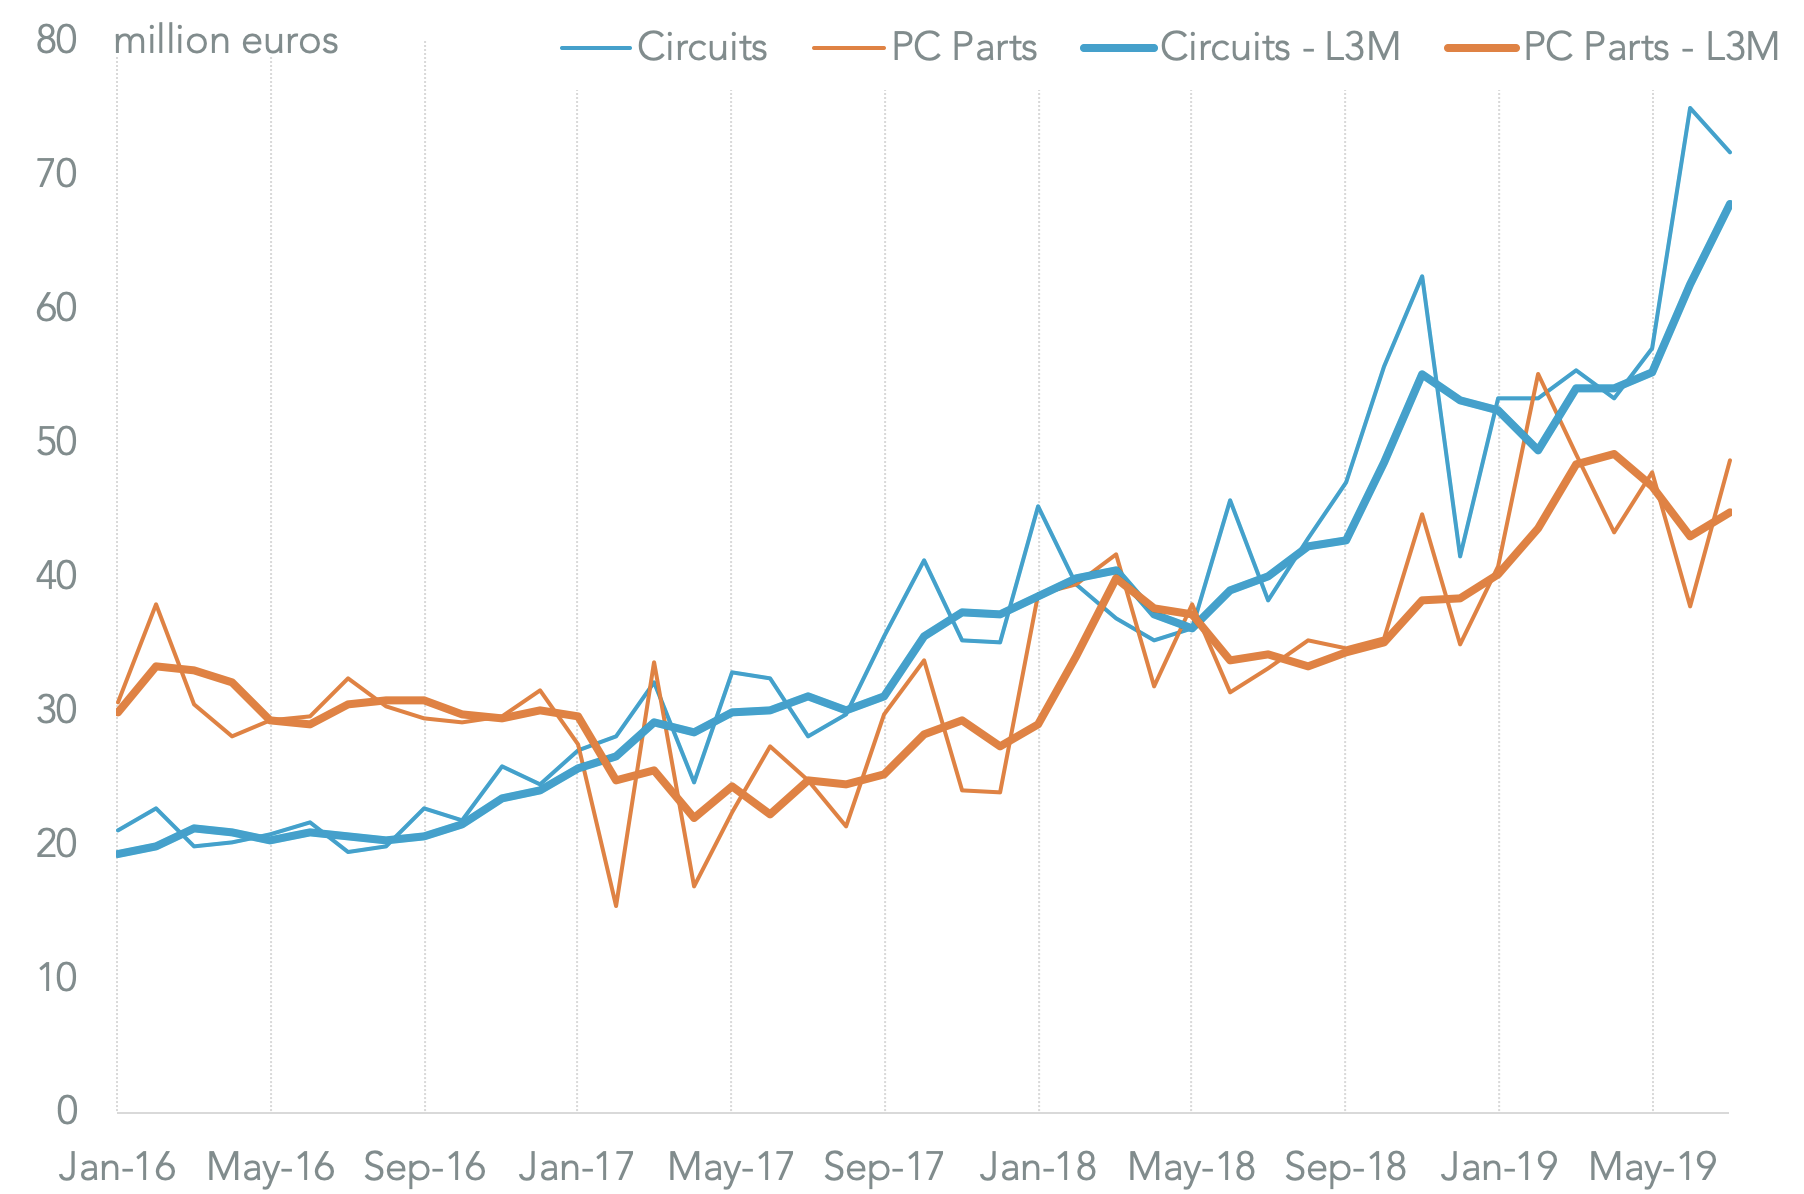
The situation is more complex for electronics components where supply chains can be more closely knit and difficult to rearrange. Exports of components have been growing more quickly than final products. Shipments of electronic circuit systems climbed 47.2% to reach 669 million euros in the 12 months to Aug. 31, while shipments of PC components expanded by 31.1% to 509 million euros.
Outside electronics shipments of pharmaceuticals represented 11.0% of the total after a 21.5% increase while the energy sector overall represented 7.2% though growth was just 2.1%.
Source: Panjiva


