Es
EsIn testimony to the Senate Finance Committee USTR nominee Robert Lighthizer appeared to strike a more inclusive tone with regards to international partners than other members of the administration’s trade team so far. While stating the WTO is not “set up to deal effectively” with China’s industrial policy, he did still expect to bring new actions to the WTO. That suggests a more constructive approach than the prior USTR trade policy paper (presumably put together without Lighthizer’s input), as outlined in Panjiva research of March 1.
Aside from steel, the largest part of the discussion was around agriculture. In particular he hoped to renegotiate NAFTA in a way that “doesn’t put agriculture in a precarious position”. That forms part of an attempt to boost exports – he stated agriculture “would have been a beneficiary of TPP” and sees “Japan as being a primary target”. That forms part of a broader belief that “the way to get rid of deficits and move the economy forward is through exports”. While giving export opportunities, there are also retaliation risks.
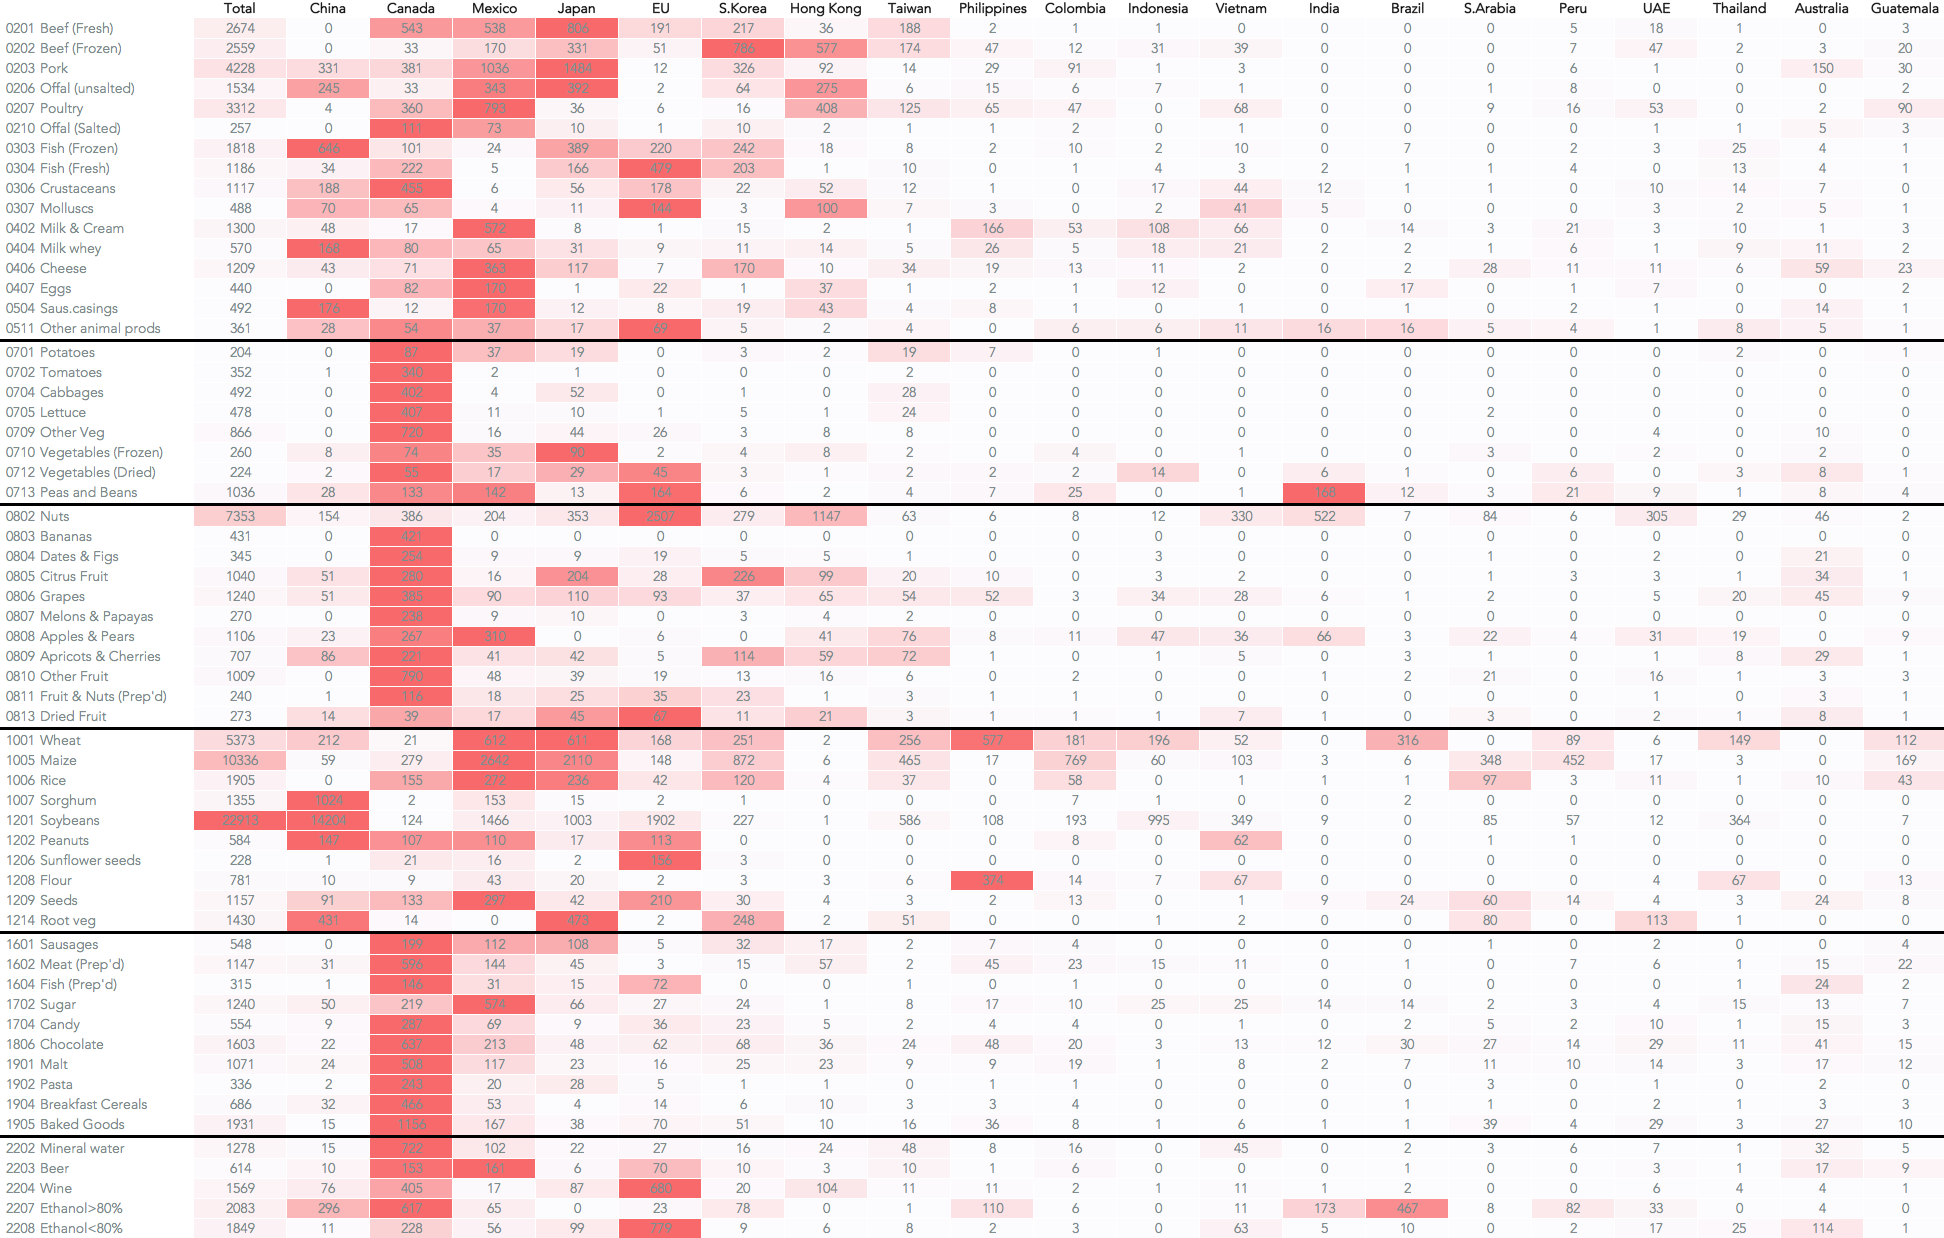
Panjiva’s analysis of the top 60 U.S. food and beverage export lines across its top 20 trade partners highlights the challenges involved. The most significant trade item is soybeans, of which a half are normally destined for China. Canada features more prominently in agricultural exports than Mexico in most case. Wheat and maize (corn) are the second and fourth largest items, with leading customer nations being Mexico and Japan. Other sensitivities are more fragmented, including pork shipments to Japan, nuts to the European Union and Hong Kong (as it were) and flour to the Philippines.
Source: Panjiva