 Es
EsA surge of shipping into the U.S. west coast has led to a swathe of congestion challenges at the ports of Los Angeles and Long Beach. Maersk’s APM Terminals has held talks with the Harbor Trucking Association at Los Angeles to resolve complaints over delays for truck drivers, Freightwaves reports.
Additionally, Hapag-Lloyd has implemented a surcharge equivalent to more than 5% of international shipping rates on volumes trucked into or out of the ports. The Port of Long Beach has reported a 17.2% rise in volumes handled in October compared to a year earlier.
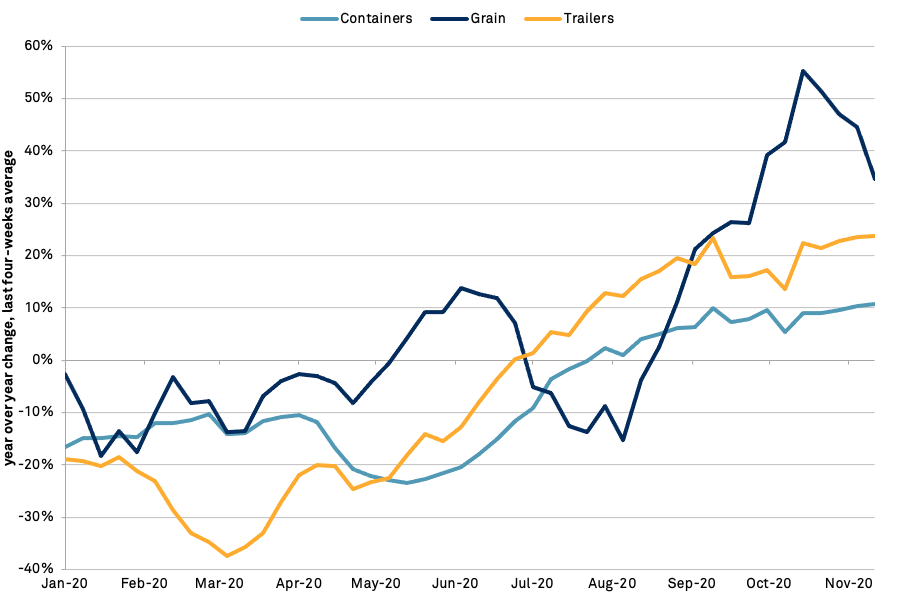
The surge in volumes across the west coast into and out of the rest of the U.S. can also be seen in traffic handled by railroad operator Union Pacific. Panjiva’s analysis of STB data shows Union Pacific’s handling of multimodal capacity has climbed steadily with container carloads up by 10.8% and trailers having surged 23.7% higher than a year earlier in the four weeks to Nov. 11.
Exports to China have also driven a 34.7% jump in shipments of grain, though shipping constraints may soon become an issue there as discussed in Panjiva’s Nov. 12 research.
Source: Panjiva
The equipment challenges can be seen in the surge in handling of empty containers through Long Beach, likely reflecting empty containers being returned to Asia in order to ensure sufficient capacity for exports from China among other countries. The decision to transport without content also speaks to continued weakness in U.S. exports. Panjiva’s analysis of port data shows empty container handling through Long Beach climbed 31.8% year over year in October to a record 289,517 TEUs while exports declined by 12.9%.
![]()
Source: Panjiva
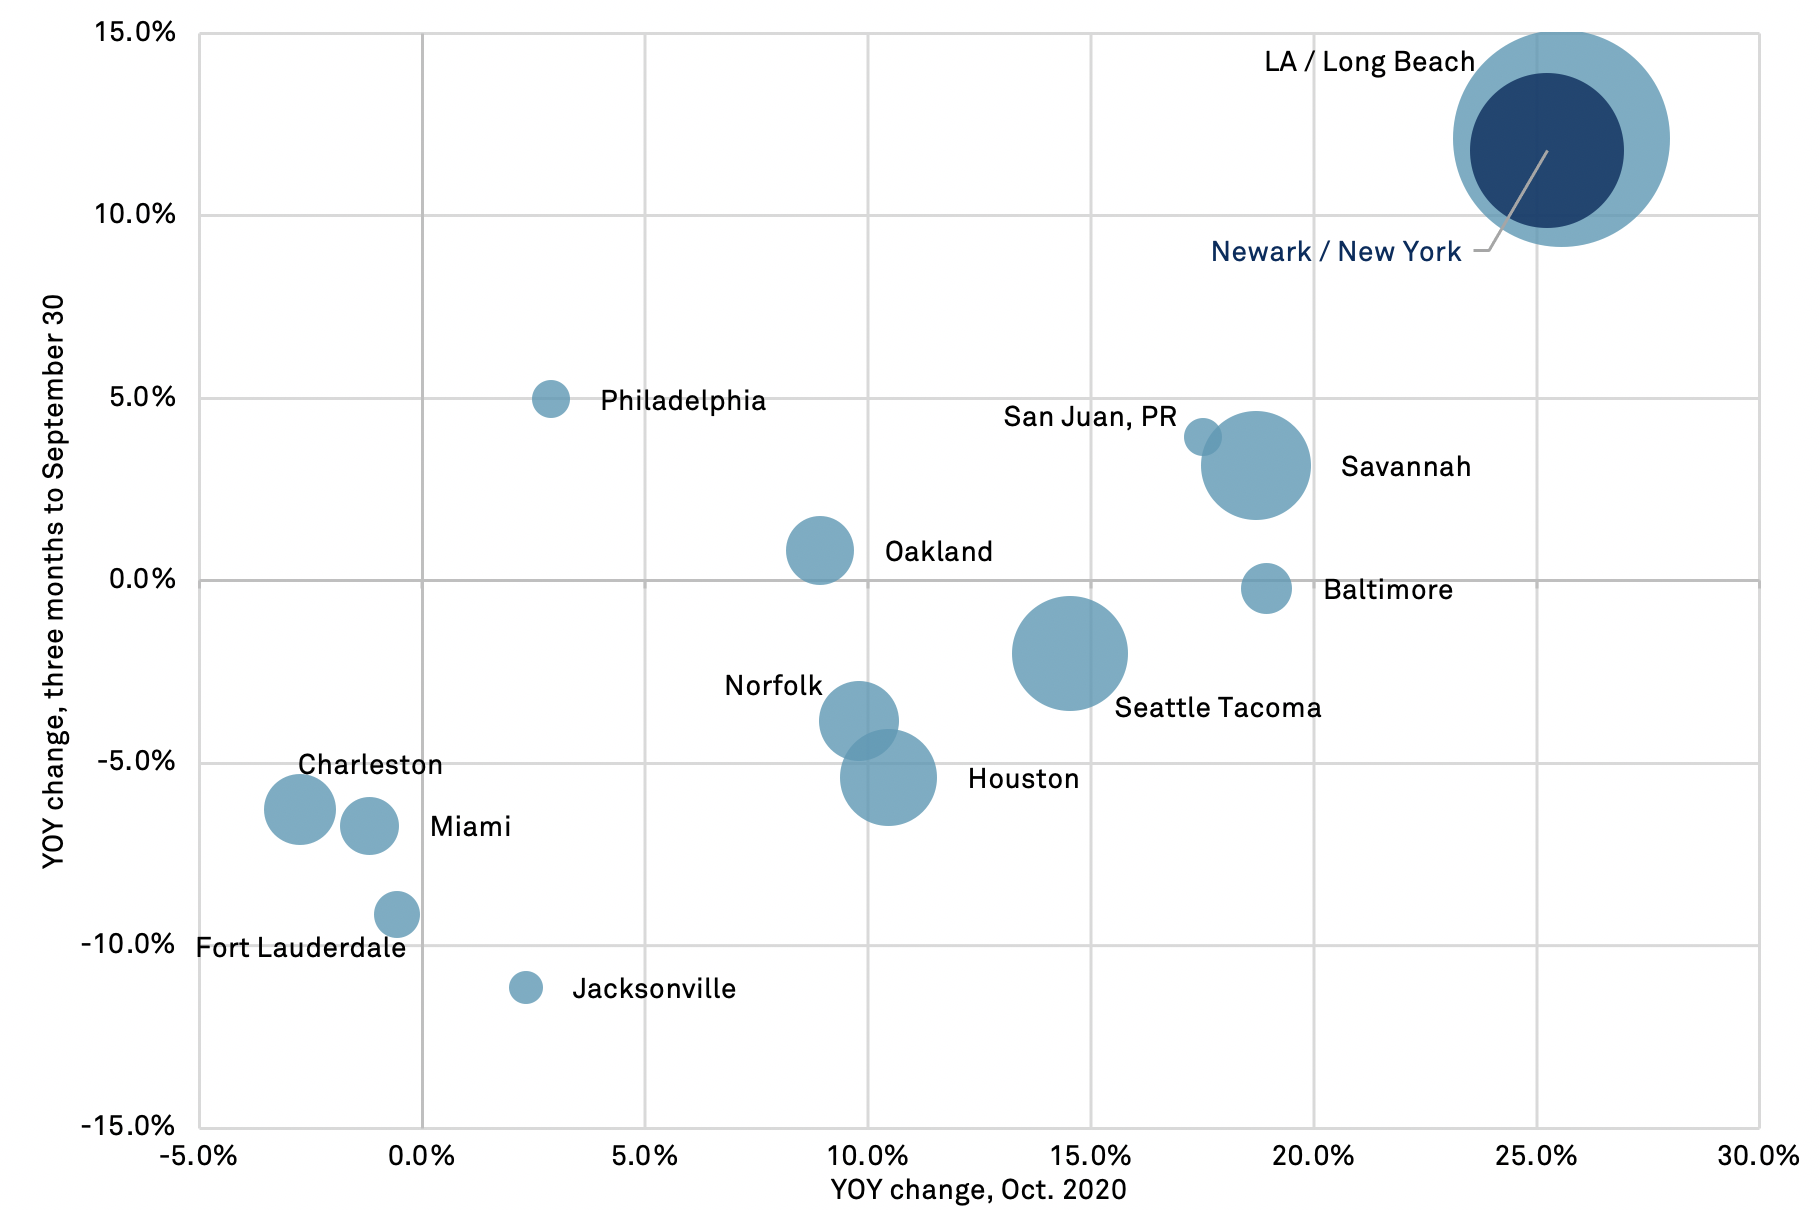
Looking more broadly, total U.S. seaborne imports climbed by 16.9% year over year in October, Panjiva’s data shows, the third month of recovery after the industrial lockdowns linked to COVID-19. Among the major port complexes, LA and Long Beach combined delivered growth of 25.6% year over year, leading the group.
On the east coast the best performing complex was Newark / New York with an expansion of 25.2% following an 11.8% rise in Q3’20. The better performance of the larger ports likely reflects additional flexibility to deal with blank sailing cancellations. New York may also have attracted shipments away from Norfolk, which grew by a slower-than-average 9.8% after losing traffic in the prior six months due to heavy application of blank sailings.
The worst performing port was New Orleans with a 23.5% drop in October following a 26.4% drop in Q3’20. That’s likely been due to closures and regional economic disruptions caused by the record hurricane season. Heavy weather may also have taken a toll on the performance of Charleston and Miami which declined by 2.7% and 1.2% respectively in October.
Source: Panjiva


