 Es
EsThe U.S. retail industry has faced a challenging 2020 as a result of the COVID-19 pandemic resulting in store closures and causing disruptions to supply chains. While many retailers experienced a challenging Q3 that was only partly saved by e-commerce sales, exemplified by Levi Strauss as outlined in Panjiva’s Oct. 9 research, there are signs of recovery. The National Retail Federation has indicated retailers are “stocking up earlier than usual” as they expect customers to want to avoid crowds and shipping delays with some merchandise “that normally wouldn’t arrive until Halloween is already here“.
Panjiva’s U.S. seaborne data shows that shipments of consumer discretionary products (electronics, furnishings, appliances, leisure products and apparel / textiles and excluding autos) climbed 23.2% year over year in September. That represents an acceleration from 18.5% a month earlier and 1.9% in July. It also means that shipments of the products have set two sequential records of over one million TEUs per month.
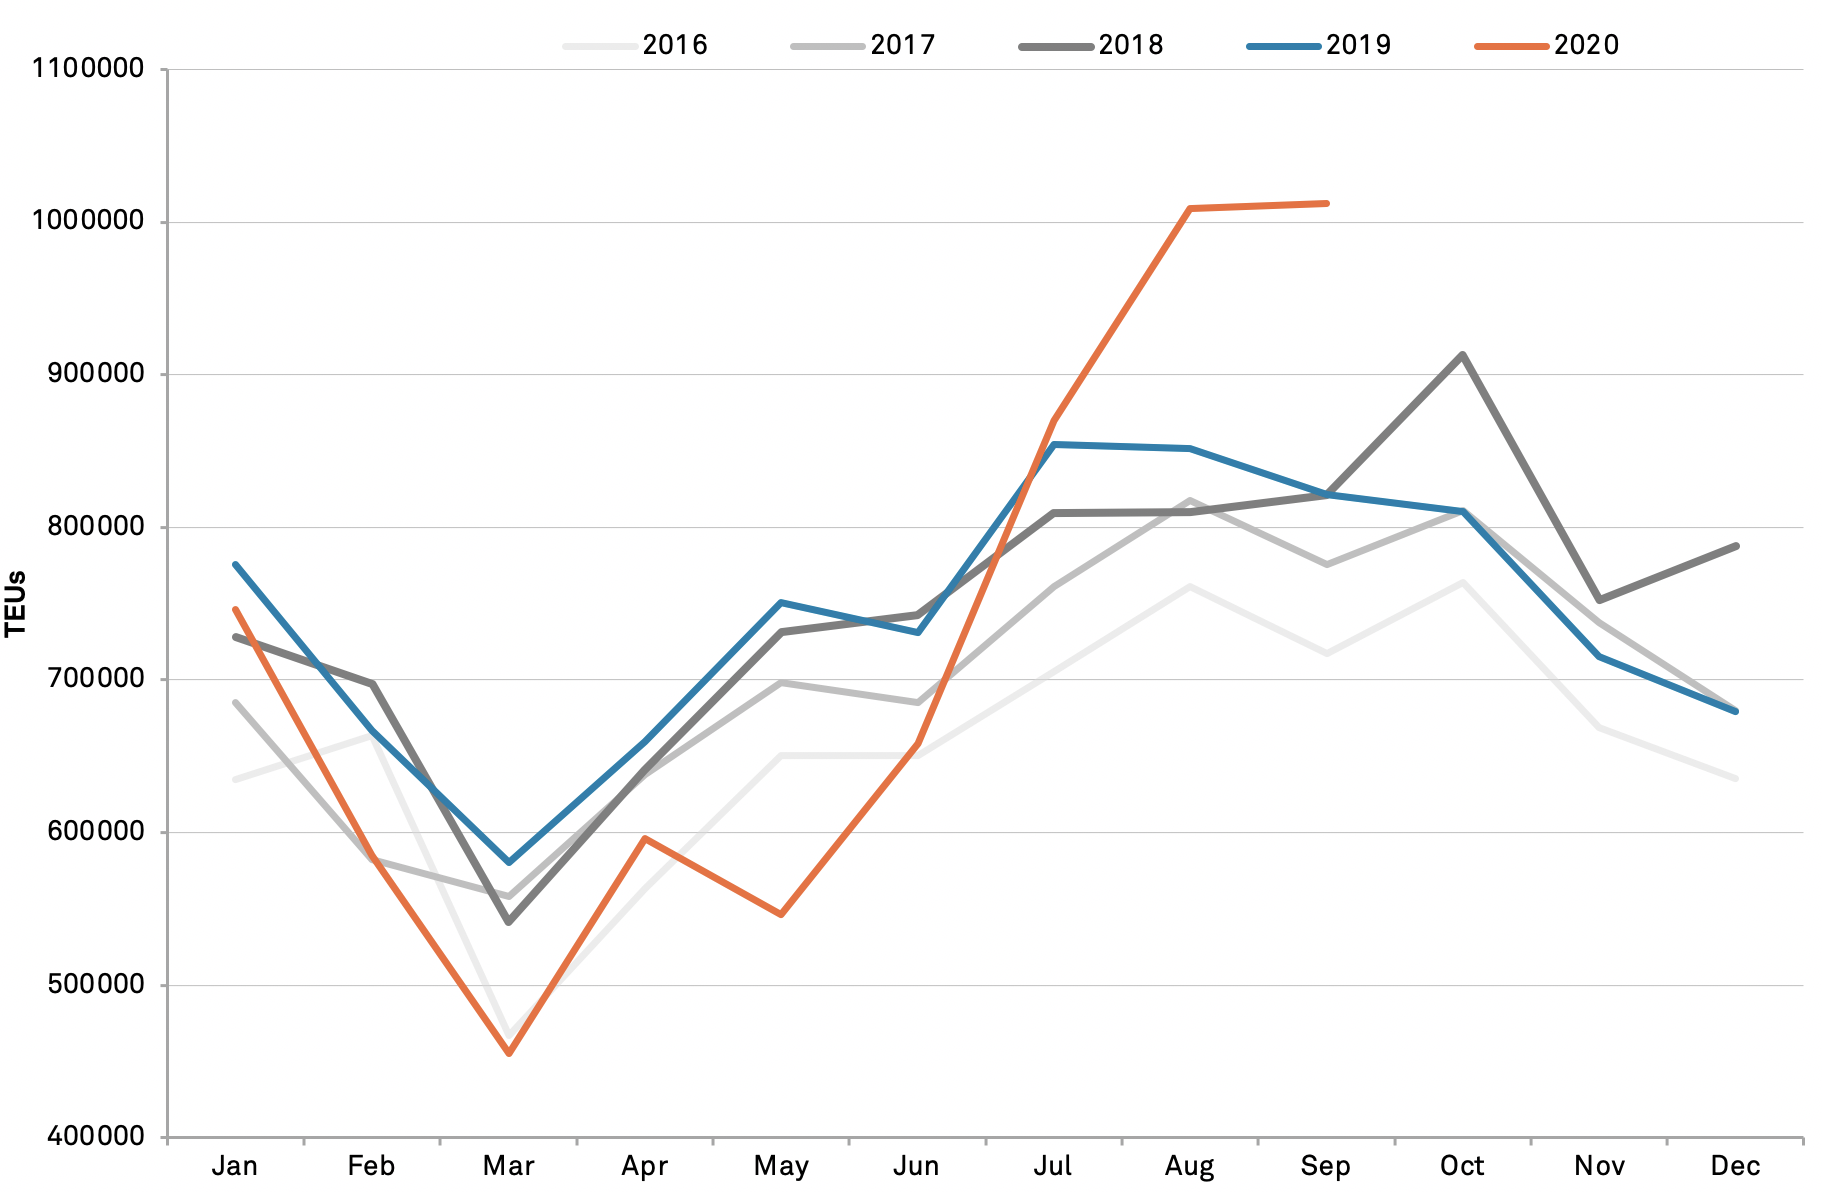
Source: Panjiva
There’s been a far from consistent performance among the sub sectors however. Shipments of home furnishings and household appliances have continued to lead the way with a third straight month of double digit gains at 47.3% and 57.5% year over year respectively in September as consumers improve living conditions now they are spending more time at home.
The fastest pickup can be seen in consumer electronics which climbed by 17.5% in September after a 7.6% improvement in August which may reflect increased activity by importers such as Best Buy as well as manufacturers including Samsung Electronics.
At the other end of the scale, imports of leisure products, including toys already discussed in Panjiva’s Oct. 5 report, and textiles / apparel have made little headway with increases of just 0.8% and 0.9% respectively. Apparel has at least returned to growth after nearly a year of contraction.
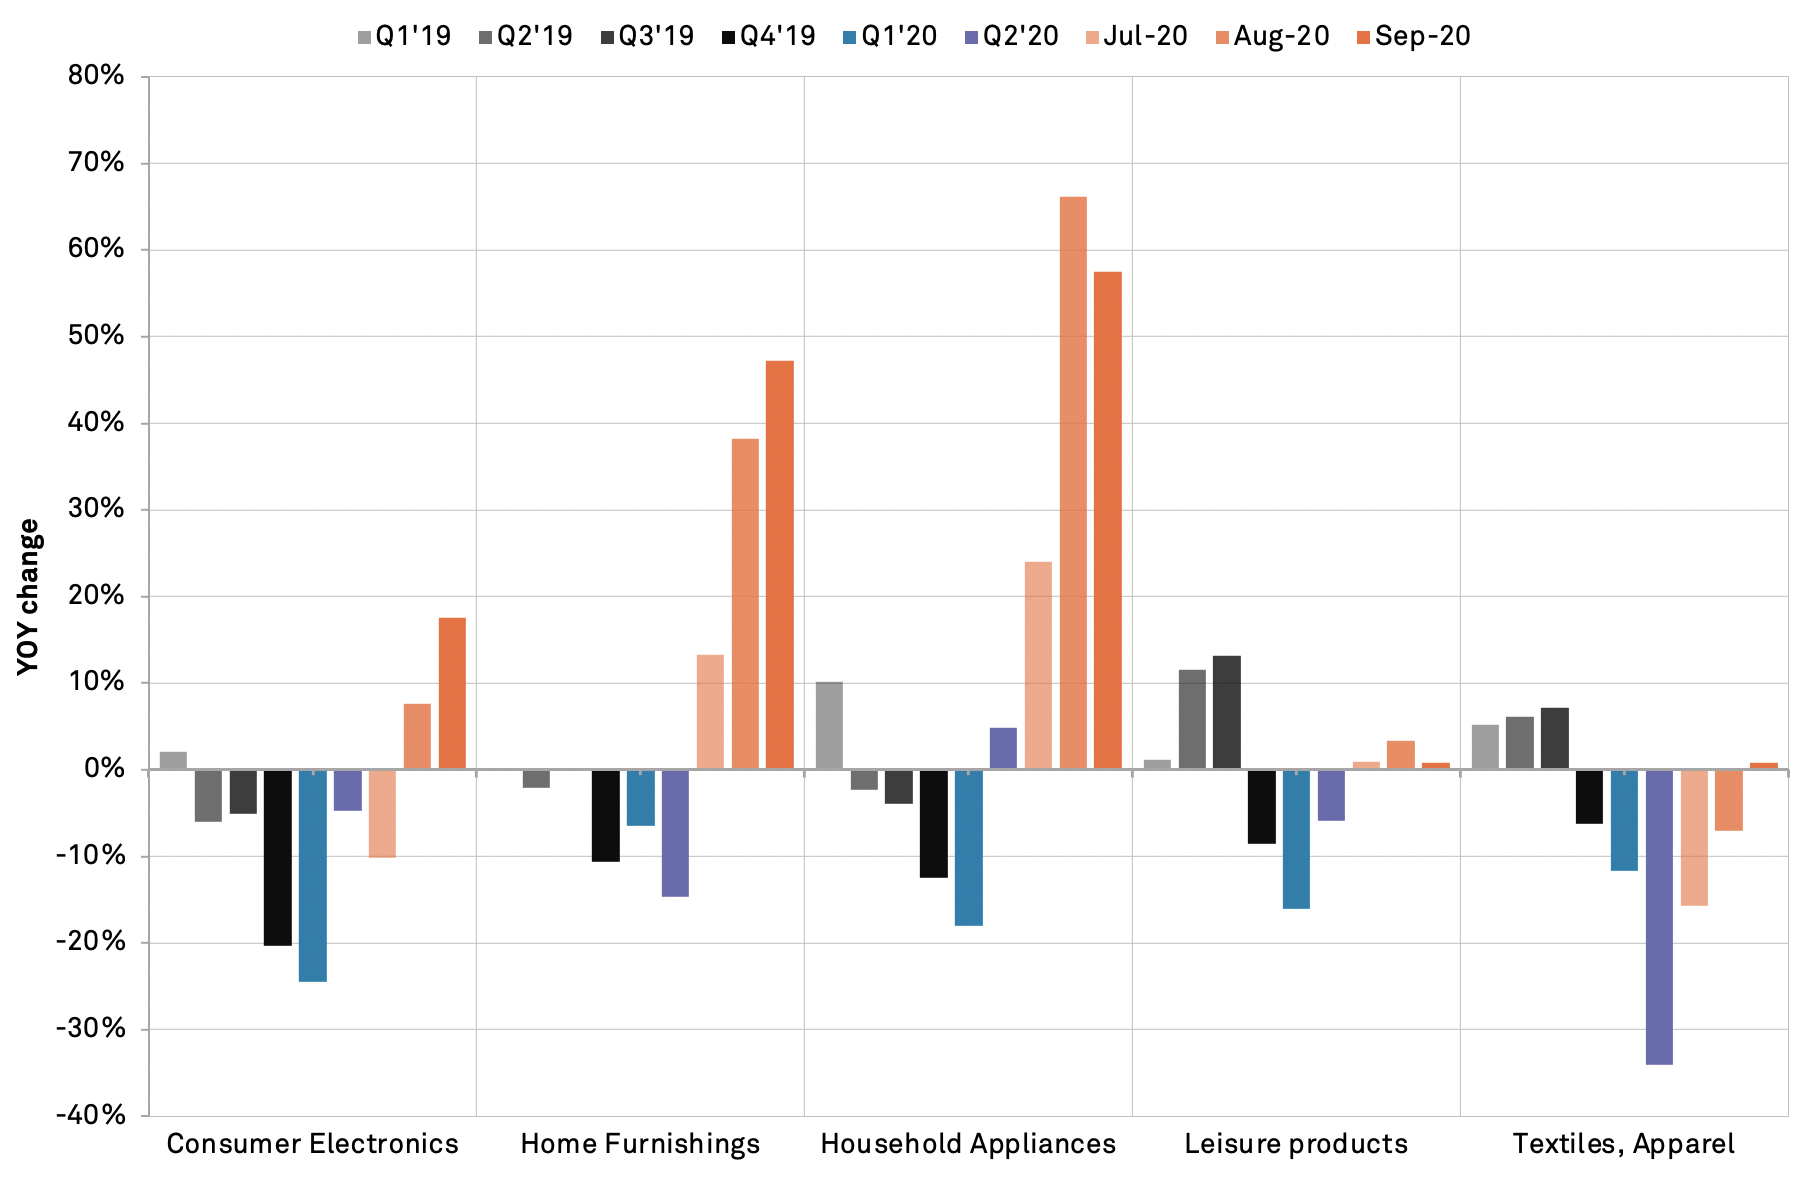
Source: Panjiva


