 Es
EsFollowing the recent five yearly National Congress of the Communist Party, the political leadership for China is set for the next five years. That raises the prospect of a continued evolution in the country’s trade policy, including regional trade deals and handling trade partners it doesn’t have FTAs with including the EU. Despite a recent recovery, China’s trade has been largely stagnant.
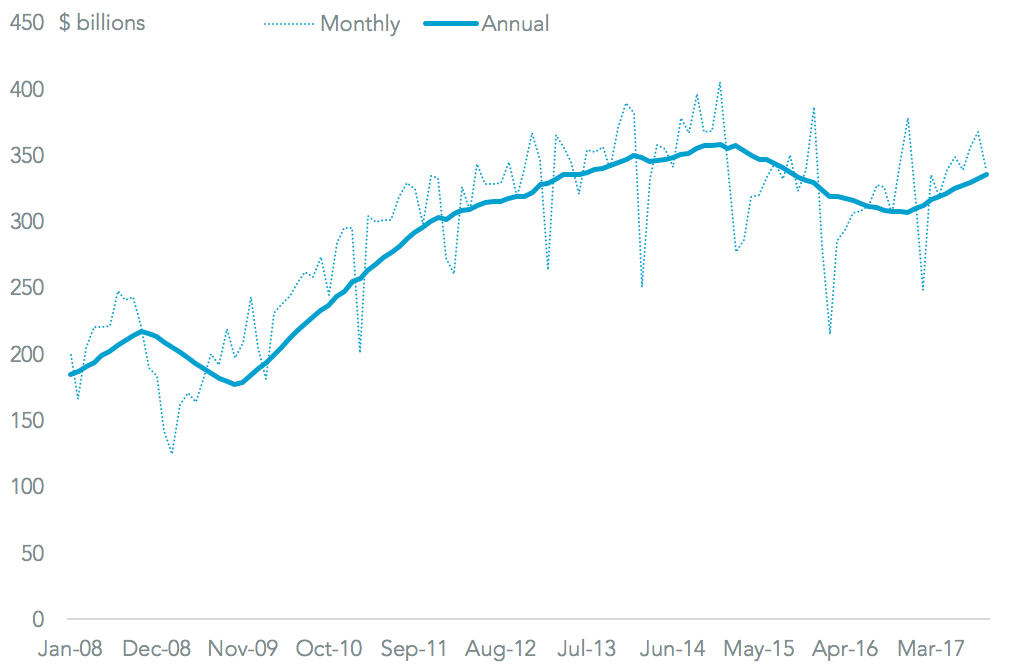
Panjiva data shows total trade (measured by the some of goods exports and imports) reached $4.03 trillion in the 12 months to October 31. While that was 7.7% better than a year earlier growth over the past five years has average just 0.6% annually, and is still 6.4% below its 2014 peak. The recovery has been driven by imports, which rose 16.3% in the past quarter on a year earlier, while exports expanded by just 6.7%.
Source: Panjiva
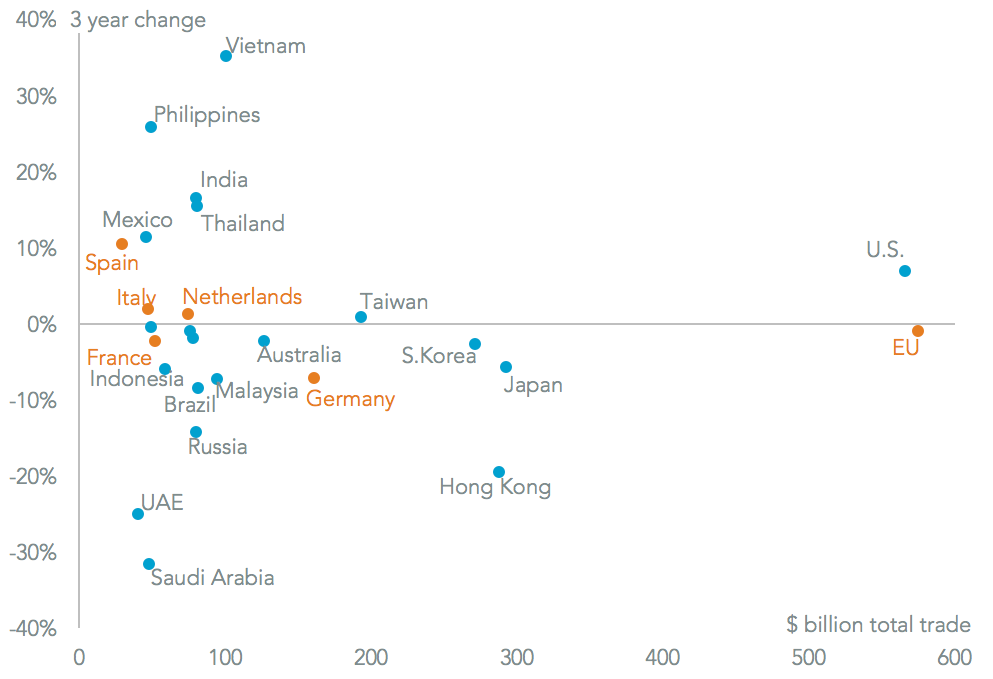
A segmentation of trade by destination country and country of origin shows the slowdown in trade partly reflects an earlier decline in raw materials costs, as can be seen by the drop in trade activity with OPEC members including Saudi Arabia (down 31.5% in the past 12 months vs. the same period three years earlier) and the UAE (25.0% lower). It also reflects a shift in manufacturing centers for major Chinese companies with a shift to lower cost production centers.
A growing trade in components and assembled products can be seen in trade with Vietnam (35.3%), resulting in it being the eighth largest counterparty from 13th just three years ago. A similar pattern can be seen with the Philippines (35.3% higher), Thailand (16.6%) and to a lesser extent Mexico (11.4%). The U.S. remains China’s number one trade single nation counterparty, with bilateral trade having expanded 6.9% to $566 billion annually, while the EU is the largest customs union partner at $575 billion.
Source: Panjiva
The reliance on the U.S. and EU as trade partners has, in part, led the Chinese government to put together a regional trade group as a counterbalance. As outlined in Panjiva research of November 10 that has led to calls, led by President Xi Jinping, to push towards multilateral deals in the Asia region.
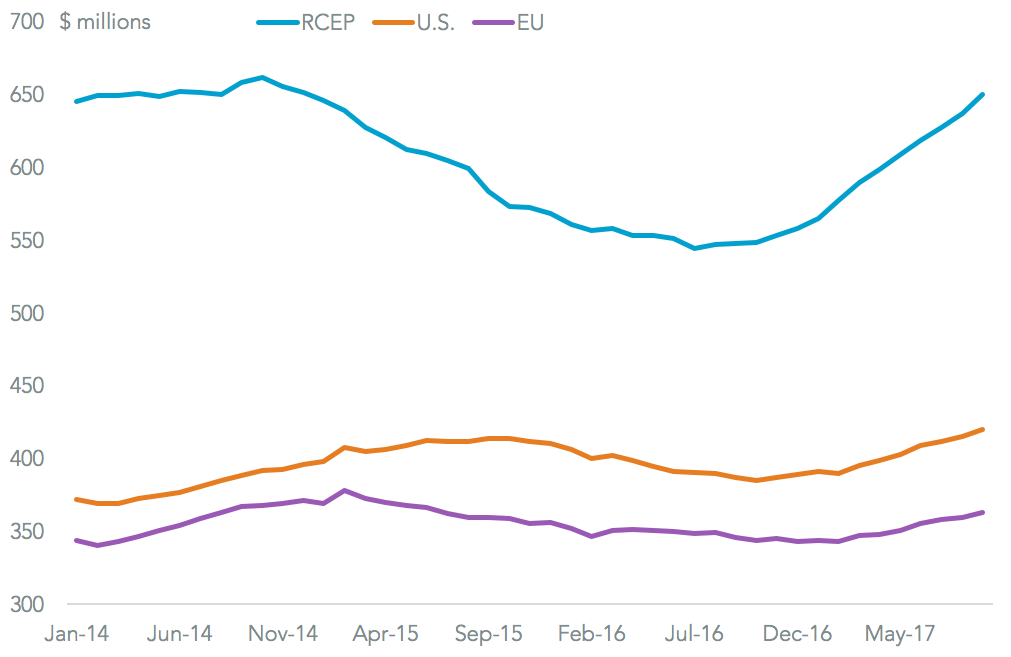
Main among these is the Regional Comprehensive Economic Partnership (RCEP) that is centered on ASEAN, but includes China, India, Japan and South Korea. The RCEP group accounted for 29.4% of China’s exports in the 12 months to September 30, and 34.3% of its imports. That compares to 19.0% of exports going to the U.S. and 16.4% to the EU.
Source: Panjiva
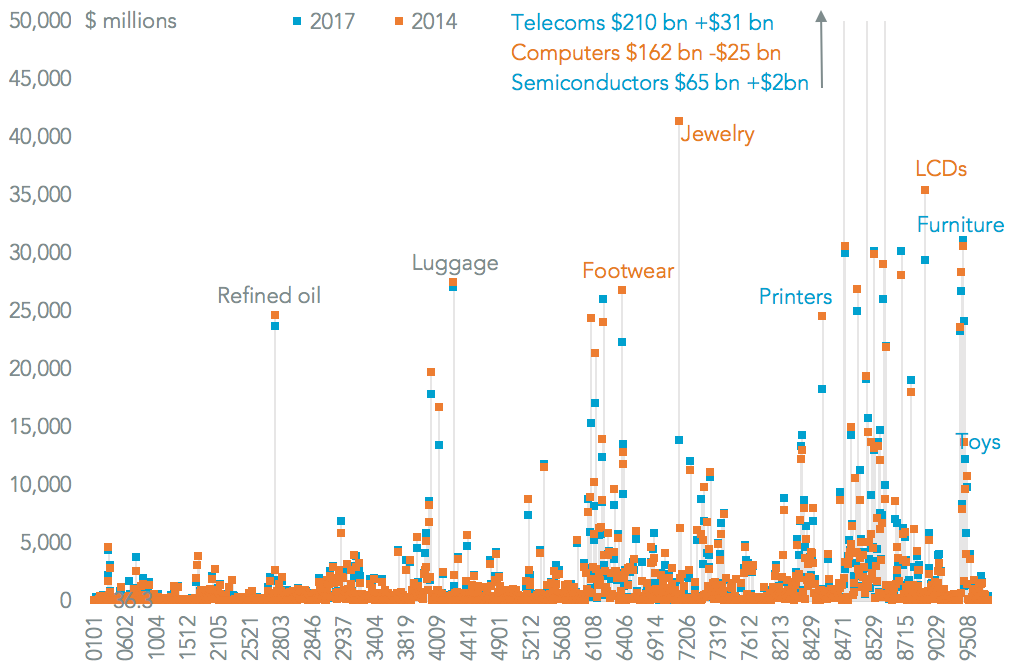
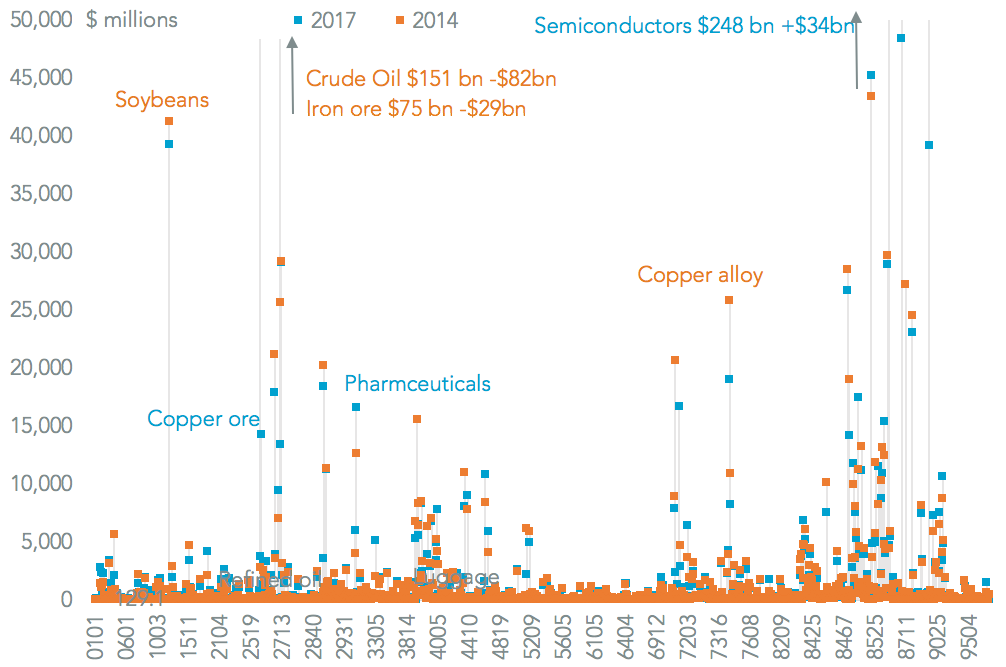
Any future trade deals, including RCEP, would be expected to increase China’s market access for its exports. At the product level, the most important export lines are telecoms (smartphones and network equipment) accounting for $210 billion of sales, followed by computers ($138 billion) and semiconductors ($65 billion). A large part of the contraction in exports has been driven by the offshoring of computer production(15.4% lower) and printing machines (down 25.5%).
Outside electronics the largest area of growth has been in toys which have expanded by 76.4% to reach $26.6 billion. Meanwhile furniture ($31.0 billion) and auto-parts ($30 billion) are more important but slower growing areas.
Source: Panjiva
The contraction in heavy manufacturing, and particularly the steel industry, can be seen in the leading imports where oil imports have fallen by 35.2% in the past three years and iron ore that’s down 28.3%. There’s also a reorientation to add more value to products within the country, for example with an acceleration of copper ore imports instead of copper alloys.
The electronics industry retains its primacy though, with semiconductors being both the most important import line at 14.5% of all imports and a 15.9% growth rate. One of the most important areas of growth, however, and one that is typically liberalized by trade deals is pharmaceuticals, where imports have grown by 31.8% to reach $16.6 billion.
Source: Panjiva


