Es
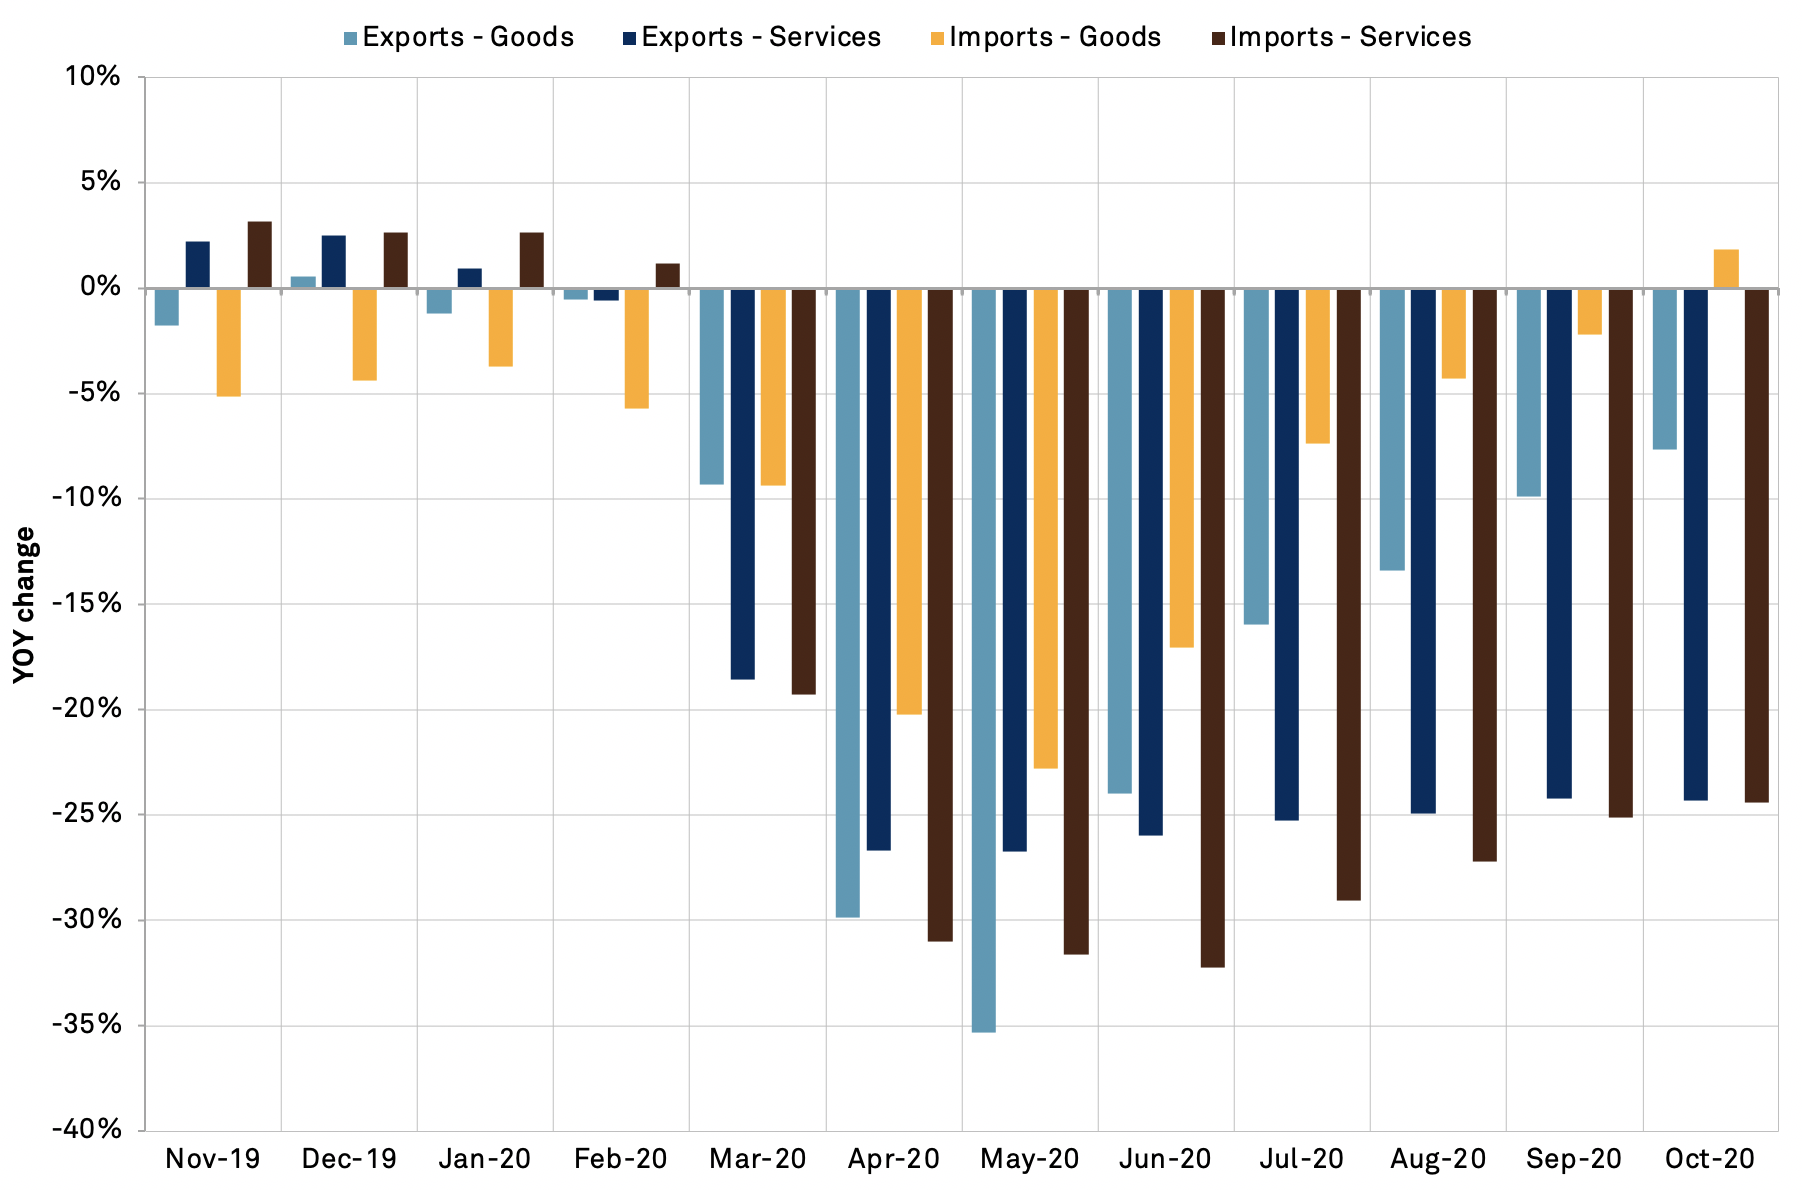
EsU.S. international trade activity in goods and services fell for a 14th straight month in October, Panjiva’s analysis of official data shows. While the contraction in total trade in goods slowed to 2.0% year over year from 5.2% in September, the fall in services trade continued with a 24.4% slump. Broadly speaking the export economy did worse than imports.
Exports of goods declined despite the ongoing implementation of the phase 1 trade deal with China while imports recovered with a 1.9% improvement due to increased consumer spending, as outlined in Panjiva’s research of Nov. 26.
Source: Panjiva
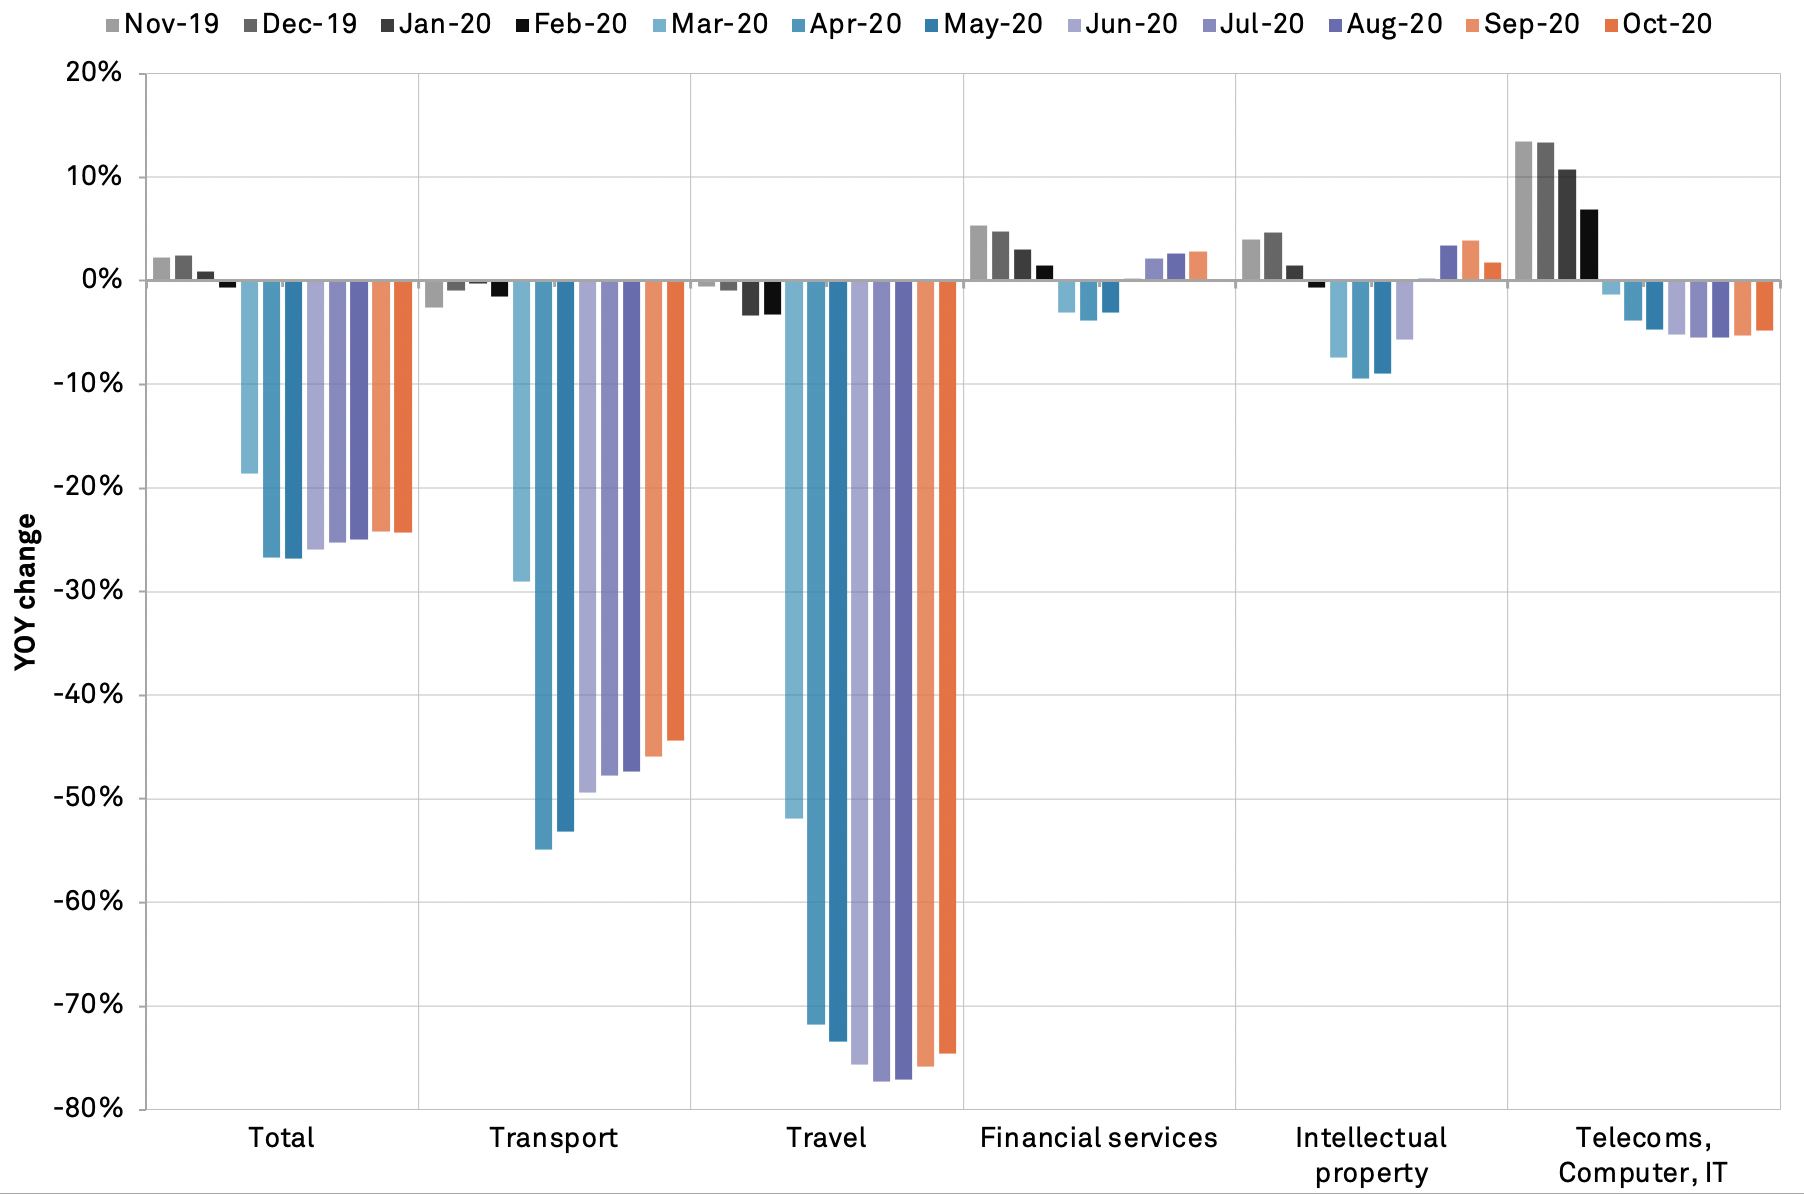
The downturn in services trade was consistent across exports and imports with both declining by just over 24.0% year over year. On the export side the continued absence of international travel has meant transport and travel services are still down by 44.4% and 74.6% year over year respectively. There’s also been a slowdown in the rate of growth in financial services to 0.1%, from 2.9% a month earlier, as well as a slowdown in growth of intellectual property services to 1.8% from 3.9%.
Source: Panjiva
The downturn in services trade has meant the U.S. trade-in-services surplus has dipped to $18.3 billion, its lowest since Nov. 2012 while the goods deficit of $81.4 billion has increased year over year by 21.3%, Panjiva data for merchandise imports and exports shows. The 12 month trailing trade in goods deficit – the Trump administration’s key trade metric where lower is better – of $866.0 billion on a customs basis compares to $735.2 billion in calendar 2016.
It remains to be seen whether the worsening statistic will contribute to short-term trade policy actions by the administration aside from measures already in flight against China and Vietnam in particular.
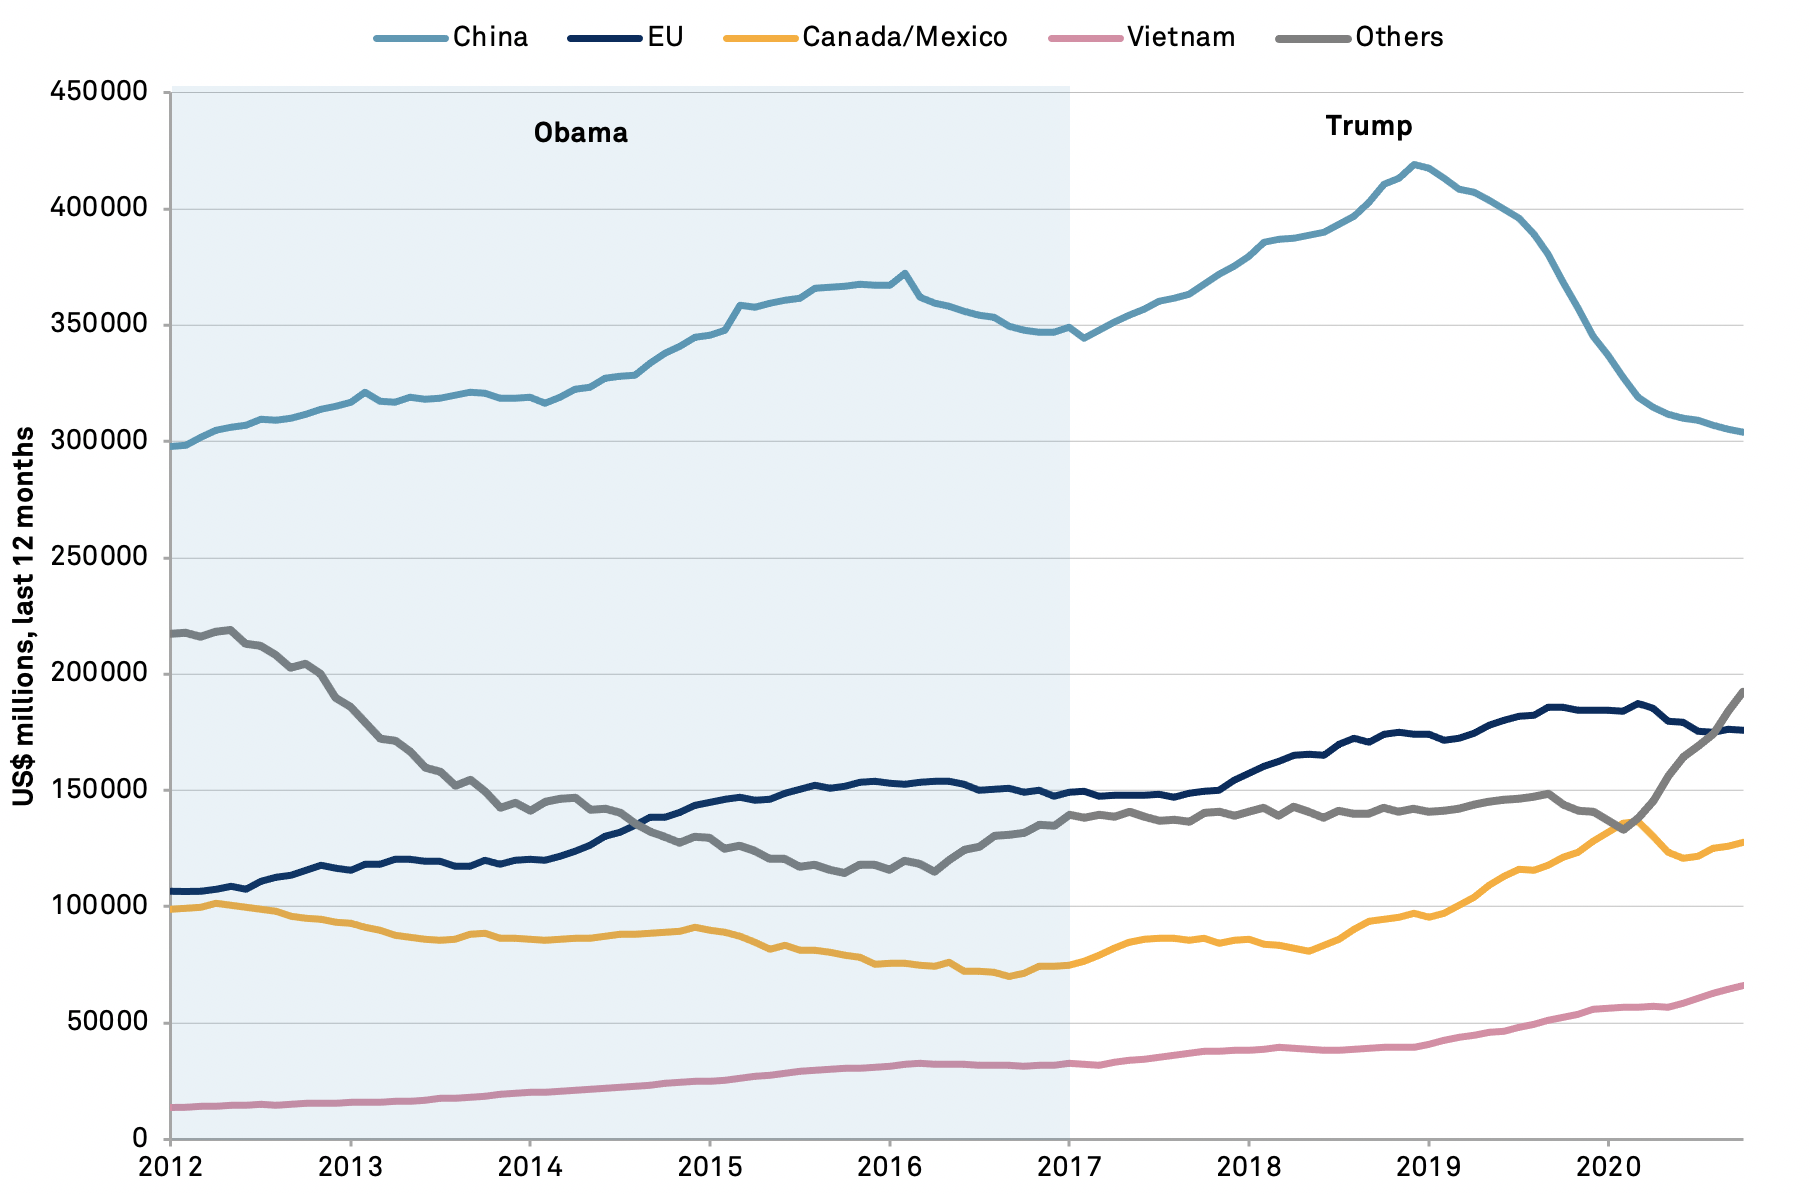
The trade deficit with China dropped to $304.0 billion in the 12 months to Oct. 31 compared to $346.8 billion in 2016 while that with Vietnam climbed to $66.2 billion from $32.0 billion, effectively offsetting 80% of the reduced deficit with China. Similarly the trade deficit with the EU increased to $175.8 billion from $147.6 billion and that with Canada and Mexico climbed to $127.8 billion from $74.3 billion.
Source: Panjiva