U.S. ports handled a new record number of inbound containers in August, Panjiva data shows, after a 3.7% increase resulted in a 2.39 million TEU total. The increase was the slowest since September 2016, largely because of disruptions from Hurricane Harvey.
That is most obviously seen in the performance from Houston, which dropped 16.6% on a year earlier to its lowest level of handling January 2016. Evidence of diversions to Miami (which jumped 32.4%) and Jacksonville (30.4% higher) can be see, though these will likely reverse as a result of Hurricane Irma in September.

Source: Panjiva
Among the major port complexes Los Angeles and Long Beach continued to recover, with an 8.9% rise resulting from a surge in Asian traffic. The latter may continue as exporters seek to pre-empt protectionist measures from the Trump administration, repeating a pattern seen in July’s macroeconomic trade data, as outlined in Panjiva research of September 7.
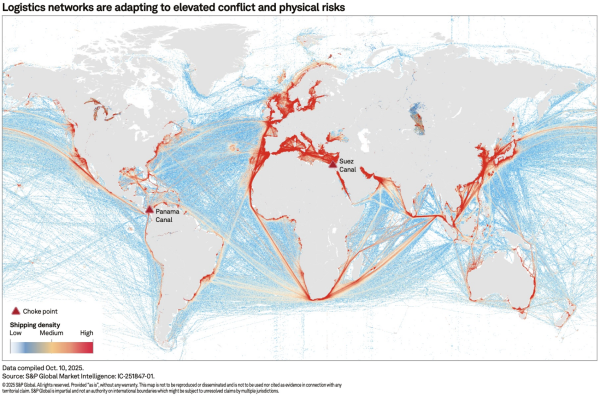
The Puget Sound ports of Seattle and Tacoma continued to slide, with an 8.7% decline at risk of continuing after the Port of Prince Rupert expansion was completed. One surprise was New York / Newark, which experienced a 0.4% decline despite the increased capacity available after the raising of the Bayonne Bridge. It also suggests traffic diversions resulting from the widening of the Panama Canal have benefited the south-east ports more.

Source: Panjiva


