 Es
EsSoaring freight costs may have added $9.53 billion to corporate costs on U.S. inbound routes alone in Q4’20. They are becoming an increasing preoccupation for executives. This report considers the key drivers and identifies which firms are impacted using data from S&P Global’s’ Panjiva, Platts and CapitalIQ products.
More shipping, more money
Consumer and industrial supply chains have had to deal with a series of challenges over the past year ranging from the initial manufacturing disruptions caused by the pandemic, through mass demand destruction during industrial lockdowns, the uneven reopening of economies and more recently a surge in demand. The latter is a high quality problem but nonetheless has brought with it a wide range of rising costs, particularly for freight expenses.
This paper looks at the causes of the freight and other forms of price inflation before noting the increasing proportion of companies that are discussing the topic in their investor conference calls and providing specific examples. Yet, there’s so far little evidence that firms have responded to the higher costs by cutting demand for goods, perhaps instead indicating that they will be passed through to consumers.
Panjiva’s data shows that U.S. seaborne imports climbed 20.0% year over year in January 2021, likely including a degree of congestion reduction of vessels that had been delayed in offloading as well as increased demand for goods. Imports of consumer discretionary goods have been the biggest driver of that growth in the absolute number of containers with growth in household appliances of 80.9% while consumer electronics and home furnishings grew by 17.2% and 34.4% respectively.

Source: Panjiva
The additional costs of shipping to the U.S. by sea alone have increased significantly in the past few months. Panjiva’s analysis of U.S. seaborne imports by shipping lane ( Asia-U.S. West Coast, Asia-U.S. East Coast, Europe-U.S. East Coast and the balance), combined with S&P Global Platts shipping rate data shows that the cost of U.S. seaborne imports reached $6.36 billion in January 2021 compared to $2.46 billion a year earlier. In Q4’20 the aggregate cost reached $15.8 billion compared to $6.29 billion a year earlier, a 151% or $9.53 billion increase compared to a year earlier.
The analysis is somewhat hypothetical. First, the rates actually paid are based on annual contract negotiations typically carried out in the spring. Second, it should be noted that the analysis excludes the cost of a variety of congestion surcharges and detention / demurrage fees which can add tens or even hundreds of dollars per container.
For comparison total U.S. customs duties (tariff income) reached $18.2 billion in Q4’20, down from $21.1 billion a year earlier but up from $9.45 billion in Q4’17 before the bulk of the Trump administration’s tariffs came into effect.
As of January though the cost of freight was higher than the cost of tariffs for the first time in the data series (July 2017). The cost of tariffs will likely increase though as a result of section 301 duty exemptions being reversed in many instances. Spectrum Brands, for example, has indicated that tariff exemptions added $25 million to $30 million to earnings in 2020 and which will reverse this year and are equivalent to 10% of pre-tax profits for the firm in 2021 based on analysts’ earnings estimates.
Looking ahead shipping rates will be driven by a mixture of secular and cyclical factors, as discussed in Panjiva’s Feb. 10 webinar. On the secular side increased spending on environmental remediation of the container shipping fleet globally and ongoing investment in expanded infrastructure may keep rates higher for longer.
On the cyclical side though, demand may decline one pandemic conditions are mitigated by the vaccine (i.e. substitution of services for goods spending) and a clearing of current congestion levels.
Even if the latter is cleared, however, there’s the potential for higher rates to persist in corporate cost bases depending on the outcome of the current annual contracting season for longer term freight services. As of mid-February Maersk’s CEO, Søren Skou, has stated “we have concluded around 40% of all our long-term contracts for the coming year, and we have seen contract rates increase across the board” with the remainder of the contract round set to run through May.
The surge in rates has led to a more conservative approach from the container-lines’ customers with Maersk’s CFO Patrick Jany noting “we see a demand for more long-term commitments, more contracts” as well as customers “not only asking for longer contract rates for the sea travel but also expanding that to having more safety, more resilience, more security“.

Source: Panjiva
Freight rates and shipping are not the only causes of price inflation facing supply chains currently. Oil prices have returned to $58.6 per barrel (WTI) having dropped to a low of $11.6 per barrel and an average of $42.8 per barrel in Q4’20, S&P CapitalIQ data shows.
That’s also had a knock-on effect on fuel costs (including bunker fuel for shipping firms), petrochemicals and plastics. The latter had been increasing anyway. Panjiva’s analysis of official data shows U.S. imports price inflation for plastics reached 6.2% year over year in December, while steel increased by 6.5%, aluminum by 15.9% and copper by 24.0%. Wood product prices have also soared by 45.6% on a shortage of wood pulp needed for personal toiletry products.
There are also increased labor costs resulting from the pandemic to contend with as firms retool their operations to provide enhanced worker safety. That’s been particularly prevalent in food supply chains ranging from the packers through the distribution segment.

Source: Panjiva
COVID-19, freight costs change the conversation
In order to gauge executive interest in rising freight costs, Panjiva analyzed transcript data from S&P CapitalIQ for occurrences of four keywords related to logistics – “freight”, “logistic”, “supply chain”, and “tariff” – to provide a profile of executives reactions to ongoing shipping price inflation. The following data tallies the occurrences of those words across the entire S&P CapitalIQ corpus for a given month against the total number of earnings call and guidance call transcripts available in the Jan. 1, 2018 to Feb. 7, 2021 period.
Executive attention has gone through three stages. The first came alongside the U.S.-China trade war, driving mentions of “tariff” to a high of 46.3% of calls in July 2018. That coincided with the implementation of the first round of section 301 duties applied from July 2019 as well as retaliatory measures applied against the Trump administration’s tariffs on steel and aluminum.
The second came with the advent of the COVID-19 pandemic which changed the refrain sharply, with mentions of tariffs dropping to 15.4% of calls while “supply chain” was discussed in 62.1% of calls in April 2020. That came as companies were working through sudden shifts in supply and demand as first China shut down manufacturing, followed by most of the rest of the world. Demand shocks followed later as those shutdowns resulted in most people staying at home, drastically changing consumption patterns.
The third phase, which is still in progress and at a small scale has been the increase in mentions of “freight” which reached 24.9% of calls in January 2021 compared to 15.0% a year earlier and close to the prior high watermark of 25.1% in October 2019. The remainder of the earnings season and the potential for elevated rates continuing into late Q2’21 may see the proportion increase further. Indeed, the first week of February has shown an increase to 28.6% of calls.
![]()
Source: Panjiva
Breaking up the data by industry shows that sectors more focused on goods saw larger upticks in mentions of freight, as opposed to sectors organized around services. Technology Hardware experienced the greatest growth in discussions of “freight” with 35.3% of calls in the three months to Jan. 31 discussing the topic. Similarly, communications equipment mentions rose to 24.1% of calls from none a year earlier. That may reflect the challenges of delivering new model phones and videogame consoles during the peak of disruptions to air and seafreight.
The largest proportion of calls mentioning freight was in the Household Durables segment with 55.2% of firms discussing the topic from 21.2% a year earlier. Similarly Home & Personal Products and Specialty Retail, which have seasonal peaks, also had significant increases in mentions of freight. While the additional costs fall on the companies in the short term they may be passed onto consumers if they continue.
![]()
Source: Panjiva
Identifying the problem is not the same as fixing it
Paniva’s research has already identified the challenges faced from higher costs across a wide range of sectors from higher freight and other costs. In the month of February so far alone that’s included toymakers (Hasbro and Mattel), leisure goods ( Peloton, Central Garden & Pet and Scotts Miracle-Gro), apparel ( Deckers Outdoor), capital goods ( Assa Abloy, Stanley Black & Decker), autos ( Tesla, Autoliv), healthcare ( Danaher) and technology ( Super Micro).
As the earnings season has progressed firms have been more definitive about the additional costs being faced. Spectrum Brands for example has stated that costs in the current financial year “are expected to be higher than we originally planned for the year by about $70 million to $80 million driven primarily by freight and other material cost inflation” CEO David Maura stated. As flagged already that compares to $267 million of GAAP pre-tax profits estimated by analysts for the firm, and is therefore equivalent to a 22% drag at the midpoint of the range assuming consensus estimates include the costs.
Battery producer Energizer meanwhile in FQ1’21 (calendar Q4’20) was “impacted primarily by incremental COVID cost of approximately $12 million largely related to airfreight, fines and penalties and personal protection equipment necessary to meet the sustained elevated demand and channel“, CFO Timothy Gorman has stated. That’s equivalent to around 10% of pre-tax, pre-exceptional profits in the quarter. Gorman appears optimistics that “As we exit the first quarter, we believe the incremental COVID costs from airfreight and fines and penalties over the remainder of the year will significantly diminish“.
Computer peripheral maker Corsair has noted that shipping costs are bidirectional, with CFO Michael Potter flagging the firm as seen an “increase in outbound freight costs due to the increase in revenue” while CEO Andrew Paul added that “inbound freight started to go up significantly, and we had to expedite because of the short supply“. There should be a turnaround though, with Potter stating the firm has “a scenario where things return a little bit more to normal in the back half of the year“.
There are few companies that are willing, however, to commit to pass higher costs through to customers in the form of price hikes either because competitive pressure won’t allow it or because of the media relations aspect of price hike commentary.
As flagged at the start of this report, many of the firms that have flagged higher freight costs are nonetheless pressing ahead with increased imports to the U.S. Indeed, Panjiva’s data for U.S. seaborne imports linked to Energizer shows its shipments jumped 261.3% year over year in January after an increase of 88.2% in Q4’20. Shipments linked to Spectrum Brands saw a more modest improvement of 16.5% in January compared to 1.6% in Q4’20. Imports among the electronics companies have reversed though, shown by Corsair whose shipments fell by 11.2% in January after an increase of 23.1% in Q4’20.
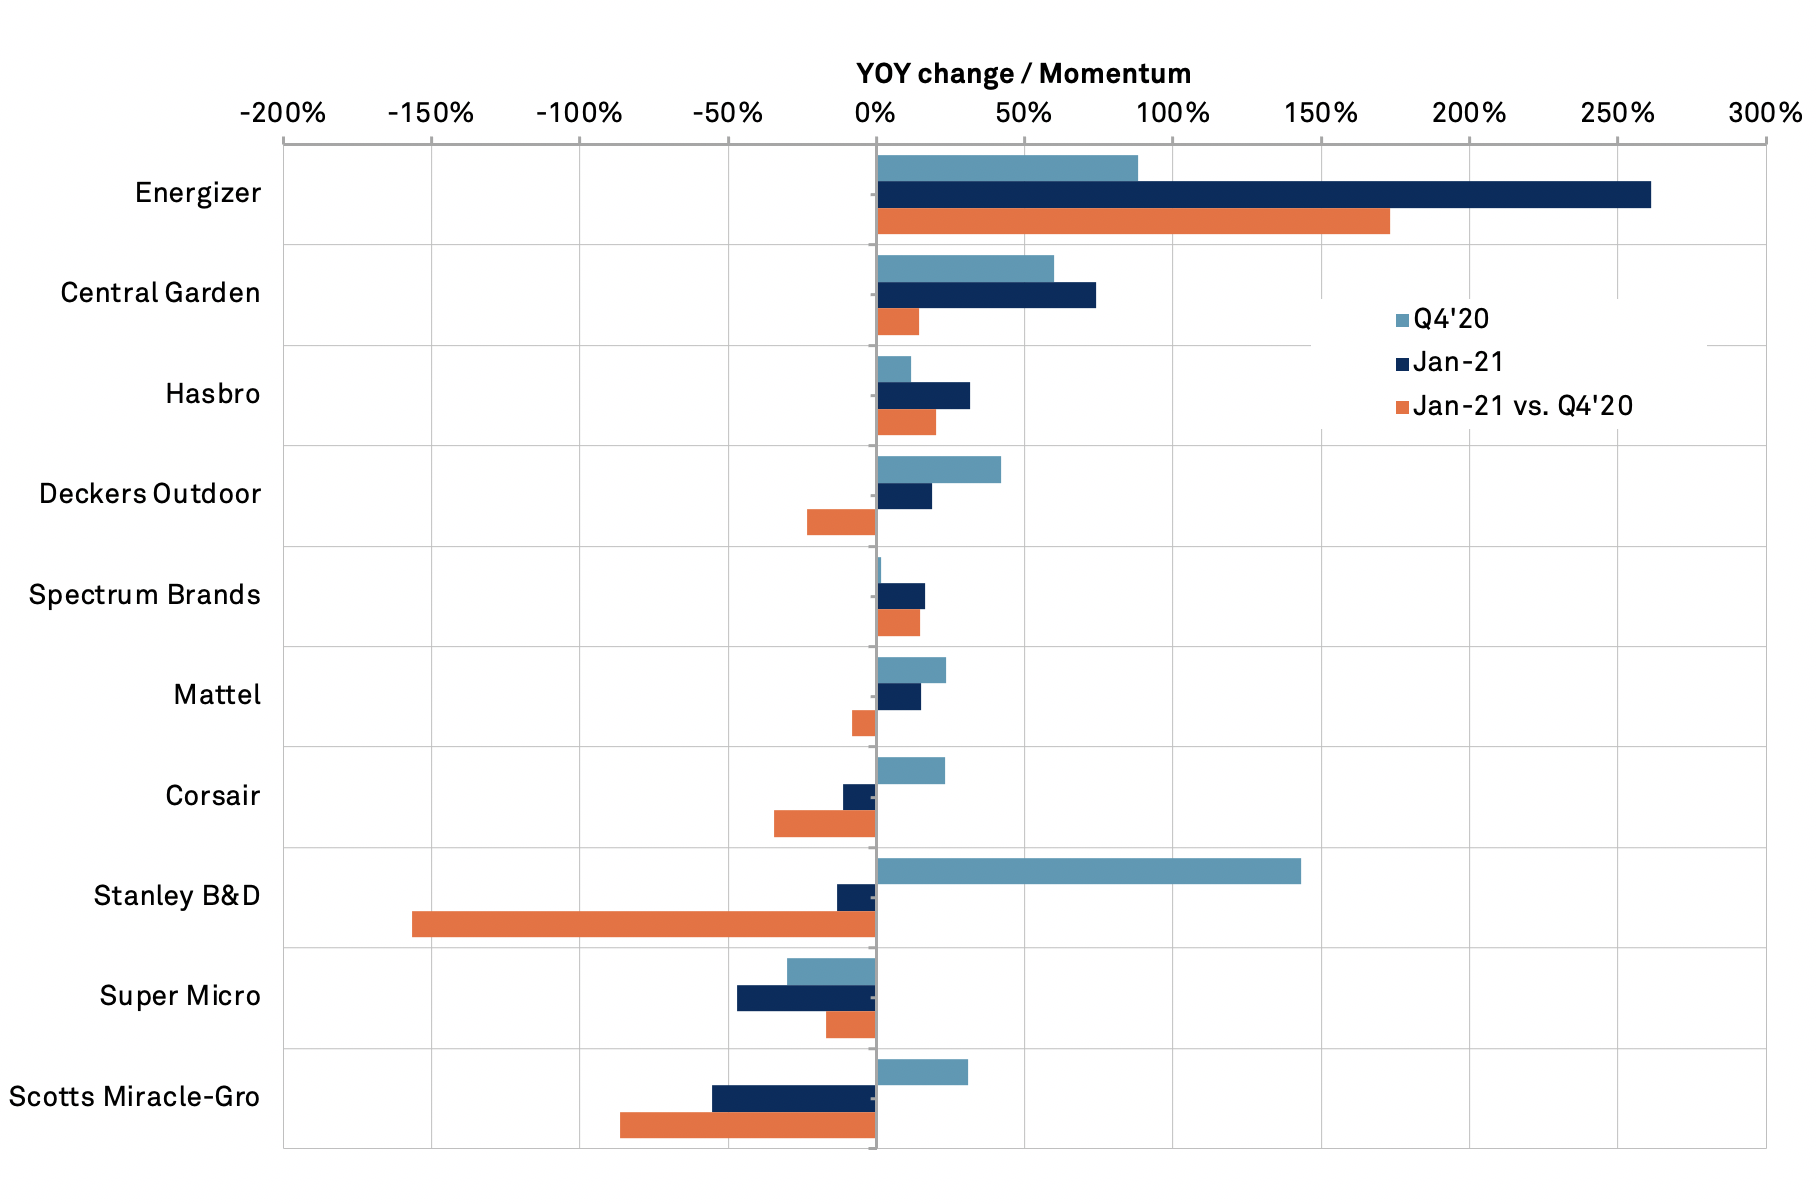
Source: Panjiva


