 Es
EsThe past 10 years have seen a series of momentous events in global trade and supply chains ranging from the emergence of China as a trade super-power, export-driven economic growth in developing economies across south-east Asia and of course the start of a trade-driven great powers rivalry between the U.S. and China. This report identifies 10 major trends and issues that will continue to be relevant into the 2020s, with baseline data from 2009 through to the most recent available.
#1 Recessions take a long time to recover from
Trade growth over the past decade, measured by exports from 37 countries and the EU, reached a 4.4% compound annual growth rate. The expansion among Asian countries reached 5.6% while the Americas achieved 4.4% and Europe 2.7%, Panjiva’s analysis of S&P Global Market Intelligence data through Oct. 31, 2019 shows.
Yet, that performance was flattered by the recovery from the great recession in 2010 and 2011. Excluding that period, and following the 2015/16 mini-recession and a more recent downturn in trade – which can be partly blamed on the U.S.-China trade war – growth was a more anemic 0.8% in dollar terms.
There was a similar pattern of growth across the regions, demonstrating the tightly interwoven nature of global supply chains that is likely to continue in the coming decade. Right now though global trade is in a downturn – exports fell 2.0% year over year in the past 12 months – making an improvement in U.S.-China relations more important than ever.

Source: Panjiva
#2 China’s become the new world super-power
China was already a top three global trade super-power at the start of the decade, Panjiva’s analysis of official data shows, but it overtook the U.S. in terms of total trade in Jan. 2013. It also overtook the European Union initially in late 2015 but is currently only 0.2% smaller than the EU. The U.S. is 7% smaller than both of them, Panjiva’s data shows.
China also overtook the EU as a leading exporter for the first time in Oct. 2014, though it is still only the third largest importer with $204.4 billion in shipments in the 12 months to Oct. 31. By comparison U.S. imports were 24.3% larger and the EU’s 12.9% larger.
The scale of imports matters in terms of geopolitical heft – in simplistic terms the largest customer has the largest say. The scale of China’s population and the government’s continue push towards middle class affluence may mean it rapidly catches the more mature U.S. and EU import levels within the next 10 years.

Source: Panjiva
#3 Populism needs an enemy
The political scene since the mid-2010s was characterized by a rise in populist rhetoric, which was often accompanied by a backlash against globalization and trade. That has led to zero-sum driven trade policies in many instances. The most extreme example was typified by the rivalry between the U.S. and China that has been running in earnest since Aug. 2017, as outlined in Panjiva’s research of Dec. 16.
The largest use of tariffs has been the U.S. application of section 301 duties against Chinese exports with rates of 25% applied to $362 billion of imports in waves through Sept. 2018 and a subsequent widening, Panjiva’s analysis shows.
As a result, while U.S. imports from China grew by 4.8% on a compound annual basis over the past 10 years, that included 6.9% growth through 2017 with a subsequent reversal of 8.1% in total. The impact of tariffs can be seen by a 13.7% drop in U.S. imports of list 1-4A tariff products in the 12 months to Nov. 30 versus 2017, while imports of all other products rose 3.7% over the same period.
There are few signs that populist trade policies will reverse – in the case of U.S.-China the rivalry between the two countries is likely to continue despite the phase 1 trade deal. Progress towards a Brexit trade deal as well as development of the Mercosur trade deal and rivalry between South Korea and Japan are other examples.

Source: Panjiva
#4 Trade deals aren’t forever
Up until the 2010s the global trade community saw a widening of trade deals. The past 10 years have shown that free trade deals can be reviewed – for example the U.S. review of KORUS and NAFTA – or even cancelled as was the case with Brexit. Deal revisions can take anywhere between months and years, leaving corporate supply chain executives with difficult decisions to make in the meantime.
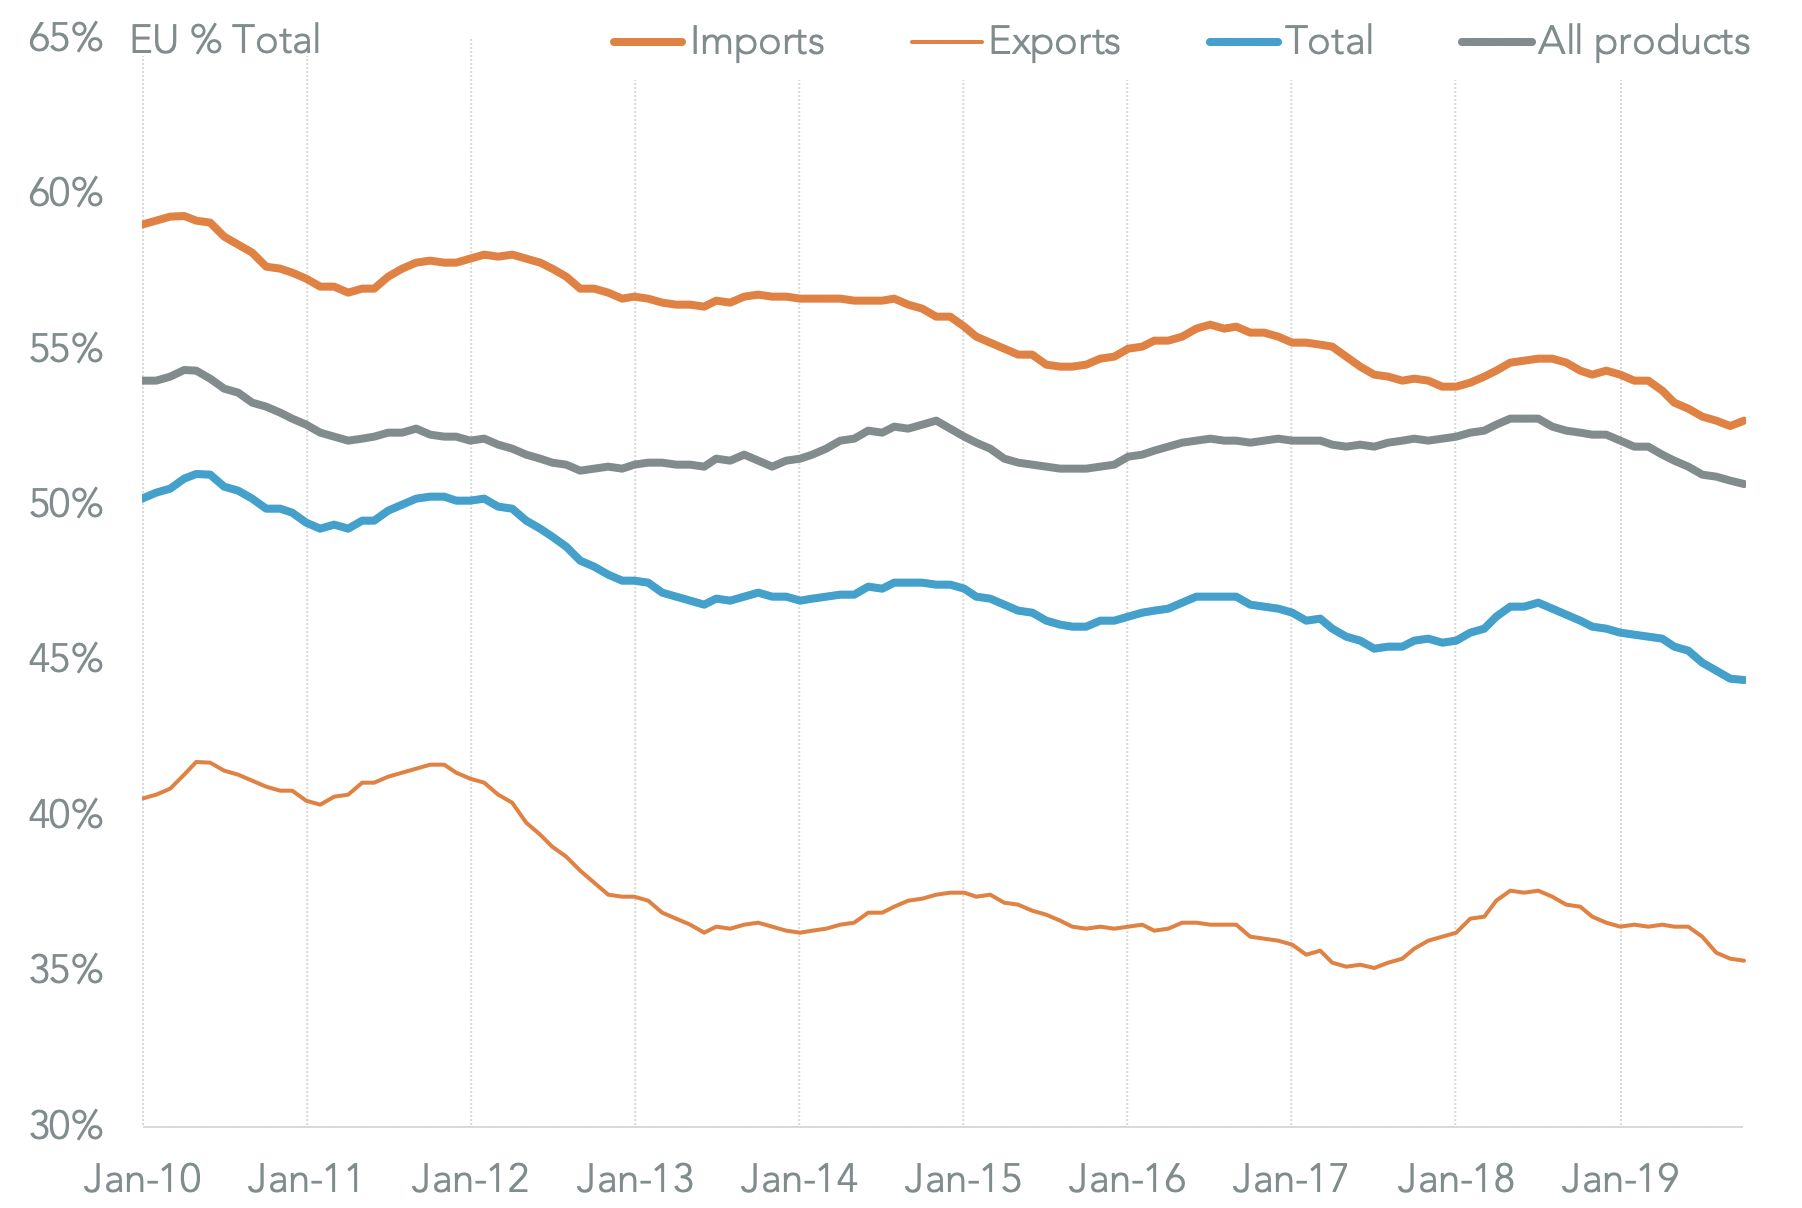
In the case of Brexit, U.K. industries are already cutting back their reliance on the EU. That’s been particularly noticeable in the manufacturing industry where imports of intermediate industrial goods from the EU fell to 52.7% of the total in the 12 months to Oct. 31, Panjiva’s analysis of ONS data shows. That compared to 54.7% in 2015 and 58.8% in 2009. Similarly, but in a smaller scale, there’s been a reduced reliance on the EU for exports of intermediate goods to 35.3% of the total from 40.5% in 2009.
The process of decoupling may continue post-Brexit, though the precise terms of the future trade arrangements between the U.K. and EU need resolving first. There will also be an impact on decision-making from new U.K. deals with the rest of the world, particularly with the U.S. and China.
Source: Panjiva
#5 The rise of mini-Chinas may not last
Over the longer-term corporations have continued to try and minimize cost of production by shifting the structure of their supply chains. For many that still means searching for lowest labor costs. For some in the past three years that’s also meant looking to optimize tariff and political risk by moving away from China, as outlined in Panjiva’s ongoing Tariff Quote Watch series.
Among the major south-east Asian countries the major winner in the rotation away from China has been Vietnam, with export growth of 16.1% over the past 10 years. Other countries have languished as a result of a mixture of exposure to commodity prices and higher higher trade, business or democractic barriers.
Yet, Vietnam hasn’t turned export growth into GDP growth with an expansion of 6.1% CAGR. For comparison the Philippines has seen GDP growth of 6.1% from export growth in merchandise of 6.0% – reflecting in part a focus on services exports. In the case of Thailand – a common manufacturing center destination to Vietnam – export growth has been a more modest 3.6% while GDP grew at 5.0%.
Looking ahead, the coming decade may begin to see a shortening of supply chains. Trade policy has a part to play as seen in the case of “ Make in India” tariffs or the U.S. section 201 protections for the washing machine industry. The “mini-Chinas” may face the risk of a backlash in the form of increased protectionism, particularly from the U.S., which governments including Vietnam are already trying to preempt.
Technology will also play its part with the rise of automated assembly and additive manufacturing processes that make in-market / for-market strategies more effective.

Source: Panjiva
#6 Supply chains became more tangled
On top of geographic diversification there has also been an increase in complexity of supply chains. Panjiva’s analysis shows the number of unique suppliers associated with S&P 500 companies over the last 12 months and 2009 increased by 8.3%.
This was led, unsurprisingly, by the internet and direct marketing retail which experienced a surge of 1002.9%. Food retailing’s ‘complexity’ score increased by 210.6%, and industrial conglomerates increased by 25.8%.
Some industries have become simpler with consumer durables firms seeing a decline of 30.0% while trade finance firms – which were burned in the financial crisis – saw a drop of 10.5%.
As flagged above, supply chains are going through a period of geographic and technological reformation though that does not necessarily mean supply chains will become either simpler or more complex. What will become more important though is visibility through supply chains to ensure continued cost and risk mitigation.

Source: Panjiva
#7 Port strikes and financing disrupted the global economy
The increasing globalization and complexity of supply chains has increased their exposure to international shipping risks over the past decade. Two major events stand out. The 2015 west coast port strike delayed the lunar new year recovery in exports and a subsequent rush in March that saw U.S. seaborne imports to the west coast jump 25.0% year over year in Mar. 2015. A sign of volatility is that the simple average monthly year over year change in imports reached 8.9% but the standard deviation was 8.7%.
A similar challenge emerged in 2016 with the financial failure of Hanjin Shipping. While only a minor player on Transpacific routes it still resulted in disruptions to shipping patterns throughout late 2016 and early 2017.
Looking ahead there’s no easy way to reduce exposure to shipping risks – container vessel fires caused by lithium ion batteries, port strikes relating to automation plans and cybersecurity risks are among the latest issues – again making diversity and visibility vital parts of supply chain strategies.

Source: Panjiva
#8 Box bearers have become bigger
One reaction from the container shipping industry to the failure of Hanjin Shipping was another round of consolidation. That partly reflects the commoditized nature of the container shipping industry that comes alongside high capital investment needs and low profit margins.
The wave of consolidation started by the merger of Hapag-Lloyd and CSAV in 2014 ran through to the three-way integration of the Japanese container-lines to form Ocean Network Express.
The share of the top 10 container lines in U.S. seaborne imports increased to 87.4% in last 12 months – down slightly from prior year’s 89.5% – from 64.1% in 2009. The consolidation does not appear to have much further to go and its questionable whether the mergers have changed market dynamics. Indeed, the European Commission appears set to continue to allow the block exemption of container-lines from cartel rules.

Source: Panjiva
#9 Fuel flows have fractured – U.S. energy independence transforms trade flows
For a simple product group the energy industry has a complex supply chain. That’s been disrupted in the past decade by the emergence of the U.S. as an energy exporter. That’s both reduced its dependence on external suppliers and led to a major new source of supply that outside the control of both OPEC and GECF.
Shale oil and gas production has meant that U.S. energy imports fell 2.6% on a compound annual growth basis over the past 10 years while exports have increased by 13.6%. That’s resulted in total imports across oil, gas and coal products falling 101% of exports in the 12 months to Nov. 30 from 471% at the start of the decade.
Further investments in liquefied natural gas export capacity will likely continue that trend in the start of the 2020s. The challenge will come in securing commodity sales against producers elsewhere in the world with lower costs. Trade deals with China and the European Union could prove critical in that regard.

Source: Panjiva
#10 Autos industry accelerated, then slowed
The autos industry has one of the widest reaching, largest and most-complex cross-border supply chains globally. The automotive market exploded over the past 10 years – imports to the U.S. of automotive parts from the EU, Japan, and Mexico grew by 9.4%, 5.1% and 13.4% CAGR over those 10 years respectively.
The shift towards vehicles was pronounced, with the proportional share of parts imports falling 5.7% from the EU, led by firms like Mercedes Benz and Jaguar Land Rover. Vehicle imports as a share also grew 2.6% from Japan, even with manufacturers like Toyota locating additional production in the U.S.
Looking ahead supply chain decision making will be complicated by the reformation of NAFTA’s rules of origin under USMCA, the rise of electric vehicles with their simpler supply chains and a rapid development in trade relations between the U.S. and EU.

Source: Panjiva


