The U.S. Trade Representative and Commerce Department have issued a swathe of reports and measures in the final few days of the Trump administration. These continue existing trade policy but don’t escalate or even de-escalate tensions with other governments.
Starting with China, the Commerce Department has added China National Offshore Oil Corporation among others to the Entity List, which restricts exports to the firms. The Department of Defense has also added Xiaomi among others to the military entity related investment blacklist.
Looking in the reverse direction the Commerce Department has also implemented a preliminary final IT and communications service import rule that will require licensing for imports in order to protect U.S. national security interests. The Commerce Department has also withdrawn eight export licenses for four companies that were selling equipment and components to Huawei, Reuters reports.
None of the moves are surprising given the latter stages of the Trump administration’s trade actions against China have been focused on incremental steps on export restrictions rather than the grand policy gestures of the phase 1 trade deal as outlined in Panjiva’s 2021 Outlook for U.S. trade policy. The USTR has also stated that “the evidence indicates that China has been moving forward in good faith with the implementation of its commitments” in the phase 1 trade deal in terms of implementation.
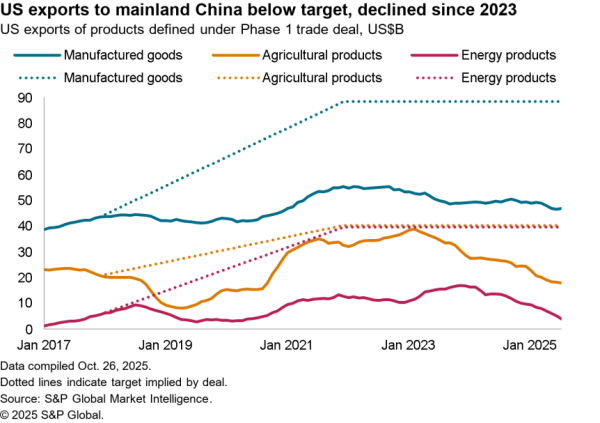
Panjiva’s analysis shows that U.S. exports of products covered by the phase 1 trade deal averaged $7.87 billion per month in 2020 compared to the $11.93 billion target level implied by the terms of the deal. While representing a significant shortfall in aggregate, shipments in November reached $11.1 billion as the result of a 308% rise in exports of agricultural products.
Given the “strategic adversary” nature of the moves it seems unlikely the Biden administration would immediately remove the tariffs initially or remove companies from the various entity lists and restrictions in the near term.
Panjiva’s data shows that U.S. exports to China climbed 11.4% higher in the 12 months to November 30 compared to a year earlier, including a 40.4% increase in December alone. That was largely down to the impact of the phase 1 trade deal. Exports of products covered by the deal noted above rose by 55.8% year over year while all other exports to China increased by a more modest 3.7%.
On the other side of the balance, imports from China 20.3% higher, though that left the U.S. trade deficit – the Trump administration’s key success for trade policy where lower is better – for the 12 months to Nov. 30 at $307.5 billion versus $346 billion in 2020.

Source: Panjiva
Away from China, the U.S. Trade Representative has released another tranche of results in its investigations of digital services taxes (DST) including Austria, Spain and the U.K. As was the case for last week’s release for Italy, India and Turkey the USTR finds that DSTs are discriminatory against U.S. firms largely on the basis of the size of revenues of American companies. Further reviews of the EU among others are underway but are unlikely to be completed.
Yet, no recommendations on response in terms of tariffs or other actions are made with USTR stating “the best outcome would be for countries to come together to find a solution.“. That process is underway at the OECD level with decisions due later in 2021. The USTR’s move reduces the risk of near-term tariffs with the Biden administration’s multilateralist tendencies likely to support the OECD process.
Another damp squib comes in the form of the section 301 reviews of Vietnam’s currency and practices. As expected, the review concluded the country does manipulate its currency to gain an “unfair competitive advantage in international trade” and that the policy actions by the Vietnamese government “are unreasonable and burden or restrict U.S. commerce“.
Surprisingly though, the USTR is “not taking any specific actions in connection with the findings at this time but will continue to evaluate all available options“. From a practical perspective that reflects the time frame involved, but will nonetheless provide the Biden administration with a useful point of negotiating leverage without the inconvenience of having to make early policy decisions or increase costs for U.S. businesses.
From a microeconomic perspective the administration has been more predictable. The Trump administration will extend section 201 tariff protection for the washing machine sector for a further two years. That’s not a surprise given an earlier recommendation of the U.S. International Trade Commission and particularly given the surge in demand for home appliances during the pandemic.
Panjiva’s data shows U.S. seaborne imports of washing machines have fallen by 17.3% in 2020 versus 2016, led by a 49.3% slide in shipments linked to Samsung Electronics and a 34.0% drop in those associated with LG Electronics. Yet, there’s been a recovery more recently inline with the rest of the appliances industry with a 93.3% jump in imports in Q4’20 versus a year earlier.
The Biden administration will likely leave most tariffs in place initially, with washing machine duties likely to remain in place longer than most as their removal won’t serve other policy purposes such as renewable energy (solar panel s201 duties) or geopolitics (steel / aluminum s232 duties).

Source: Panjiva


