 Es
EsPresident Joe Biden will host a Leaders Summit on Climate on April 22 and 23 including 40 world leaders with a view to building momentum for enhanced commitments on greenhouse gas reductions ahead of the UN climate change conference in November. That comes after an agreement reached between the U.S. and China to take “concrete actions in the 2020s” to reduce emissions, the Financial Times reports. Importantly, China’s President Xi Jinping will attend the event according to Xinhua.
It also follows the Biden administration’s decision to rejoin the Paris Agreement on Climate Change and inclusion of environmental issues in the forthcoming Infrastructure Bill, as discussed in Panjiva’s Q2’21 Outlook.
There will be implications for supply chains from deeper commitments on emission reductions including: demand for enabling technologies including renewable energy and electrification of transport, including components and materials; the need to reduce emissions across logistics networks; and regulations including carbon pricing and leakage prevention mechanisms including border taxes.
Renewable energy established enough for protectionism to creep in
The power generation industry has accounted for the largest share of greenhouse gas emissions in most countries historically and has been the first to benefit from tax breaks and other forms of incentives to switch to low-emission technologies.
The installation and upgrading of renewable energy facilities, particularly in solar panels and wind turbines appear mature enough that they are starting to attract protectionism in the form of national manufacturing strategies and tariffs on imports. Indeed, the U.S. implemented the section 201 series of tariff-rate quotas on imports of solar power equipment under the Trump administration, which the Biden administration has maintained despite wanting to accelerate renewable energy investments. The Indian government has also applied import duties as part of its wider “ Make in India” strategy.
The import duties appear to have been baked into end-customer prices, with U.S. imports having increased by 5.7% year over year in the 12 months to Feb. 28 despite a 29.7% drop in the past three months, Panjiva’s data shows. Shipments in the last three months were nonetheless 133.0% higher than the same period of 2019. Shipments from Malaysia and Vietnam have come to dominate with shares of 30.6% and 29.8% respectively in the past 12 months.
While total imports have dipped recently, seaborne imports linked to LONGi Green Energy and JinkoSolar have increased by 67.3% and 60.0% year over year respectively in Q1’21, potentially reflecting pricing-led strategies and / or expectations of further supply chain interruptions.

Source: Panjiva
The wind power sector has had less attention in terms of customs duties, outside of the metal towers used, but has nonetheless faced a similar pattern of performance. Panjiva’s data shows U.S. imports of wind power generating equipment rose by 30.7% year over year in the 12 months to Feb. 28 but dropped 37.9% lower in the last three months. Uncertainty over the extension of key tax credits and the potential to complete installations during the pandemic may have been factors.
One challenge for the manufacturers of renewable energy equipment though is cost inflation both for wind and solar power manufacturers as well as access to raw materials including rare earths – a similar challenge faced by the automakers (see below).
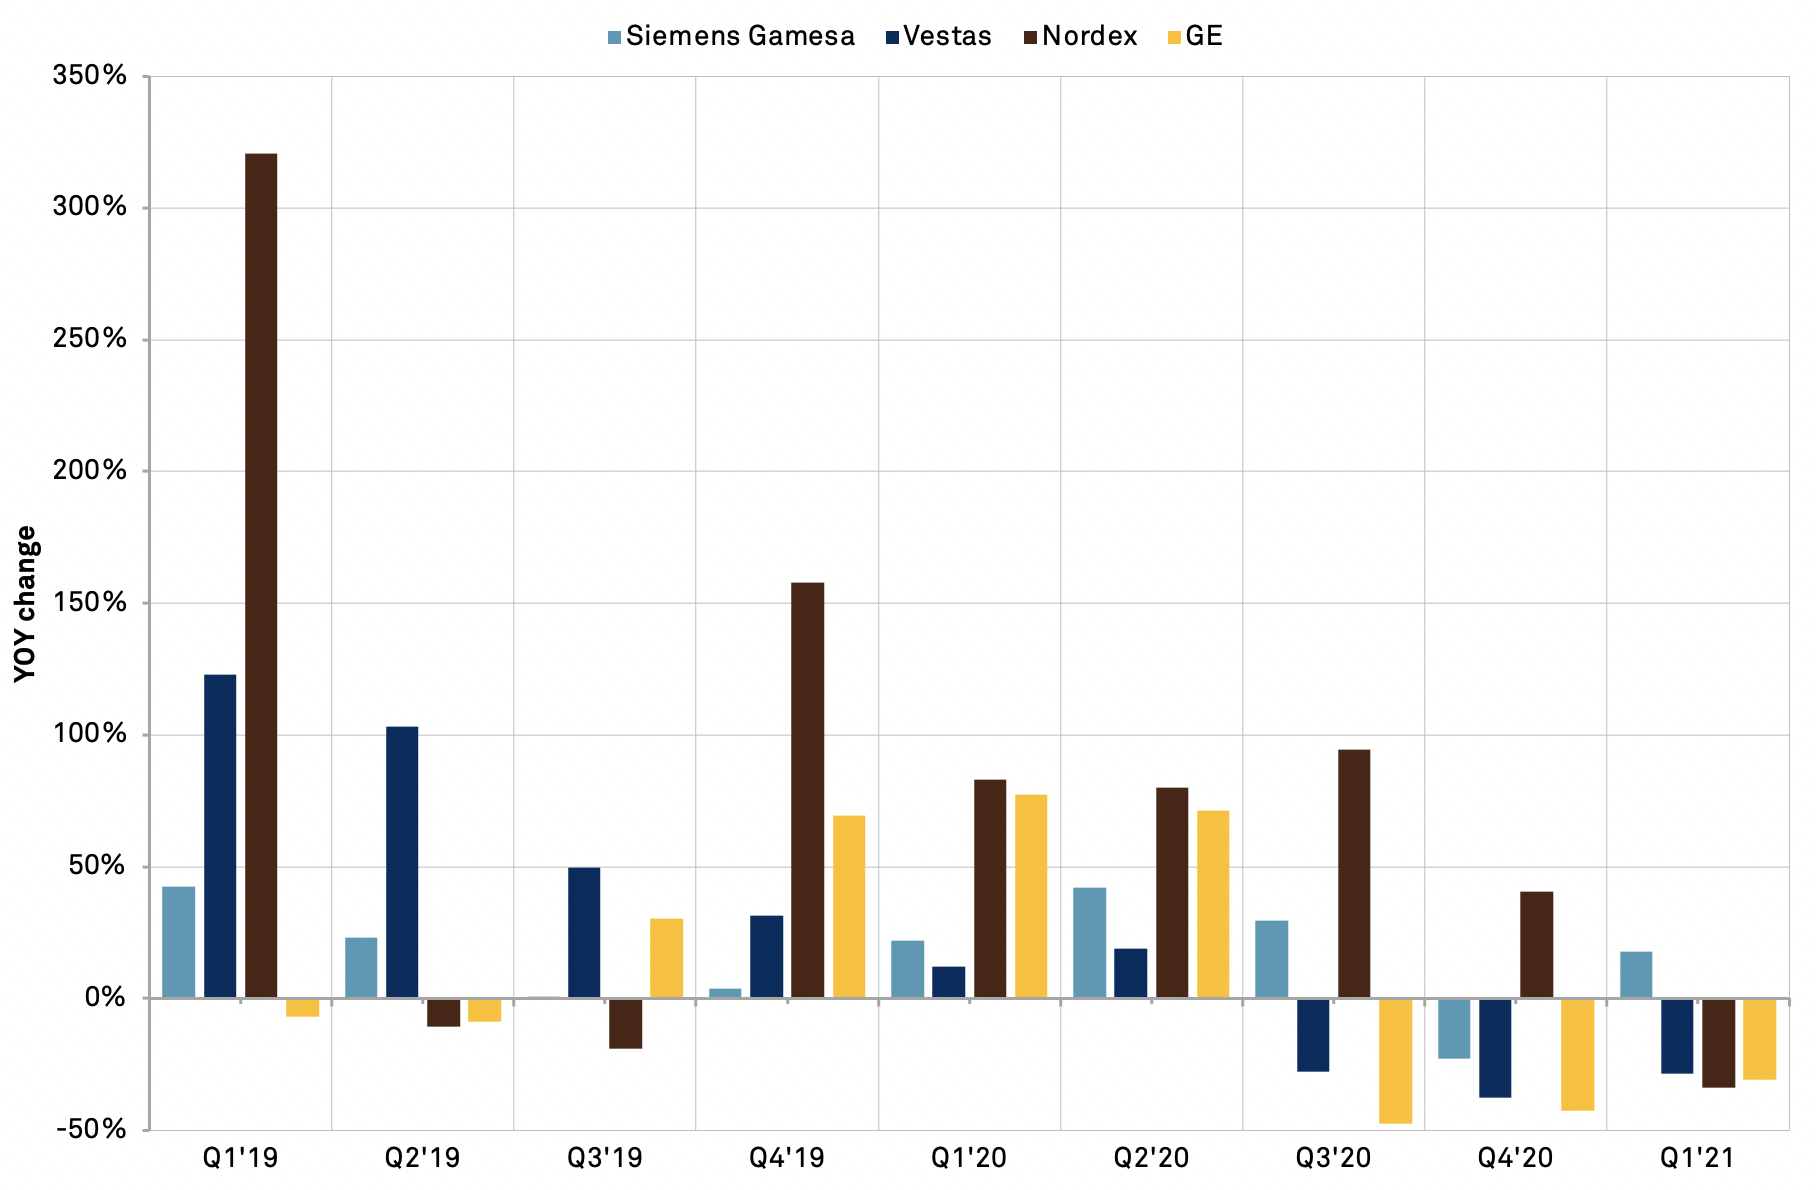
The more challenging conditions can be seen in U.S. seaborne imports linked to Nordex which dropped by 34.0%. Similarly shipments associated with Vestas and GE fell by 28.4% and 30.8% year over year respectively in Q1’21 after declining in the last two quarters of 2020 too. Siemens Gamesa has done somewhat better with growth of 17.8% year over year in Q1’21 and by 43.8% versus Q1’19.
Source: Panjiva
Everyone wants to localize local transportation manufacturing
The shift from combustion to electric power vehicles provides a unique opportunity for the automakers to reshape their supply chains, disrupters to enter the market and for governments to maneuver for an increased share of manufacturing. Most of the major automakers have well established electric vehicle strategies with mainstream models coming off the production line.
The U.S. government may be particularly keen to ensure manufacturers maintain their electric vehicle production in North America. The implementation of the USMCA trade deal from July 2020 includes provisions designed to ensure rules-of-origin regulations are future-proofed to a certain degree.
Panjiva’s data shows that U.S. exports of electric vehicles fell by 24.3% year over year in the 12 months to Feb. 28 while imports climbed 49.6%. In the three months to Feb. 28 imports were worth $1.13 billion versus $1.58 billion of exports.
The shift reflects the increased localize production for the Asian and European markets by Tesla on the one hand and increased imports from Mexico, which jumped to 36.21% of the total in the three months to Feb. 28, as a result of Ford’s production of the Mach-E model in Mexico. Ford’s exports of electric vehicles from Mexico reached $327 million in January and February combined, with 98.5% destined for the U.S. and the remainder for Germany.

Source: Panjiva
The increased simplicity of electric vehicle assembly versus ICE models provides an opportunity to localize assembly but globalize components. That’s led the U.S. government to include large scale batteries as a part of its review of critical supply chains where a review is due in early June. The settlement of an intellectual property infraction case between SK Innovation and LG Chem is freeing up investment in the U.S., most recently with LG and GM announcing plans to build a second electric vehicle battery plant in the U.S., Nikkei reports.
U.S. seaborne imports of all lithium ion batteries climbed 60.2% year over year in Q1’21, partly reflecting demand for consumer electronics as well as electric vehicles and grid storage. Shipments linked to Tesla and Toyota led in absolute terms with growth of 19.8% and a 38.1-fold increase respectively. A dip in Toyota’s imports in Q1’21 versus Q4’20 may reflect challenges from sourcing semiconductors – a widespread challenge for the automotive sector.
Shipments linked to LG Chem and SK Innovation were more volatile as a result of the ongoing IP suit with shipments linked to LG Chem having dropped by 63.6% and those associated with SK Innovation jumped 14.8-fold in Q1’21.
As is the case with renewable energy equipment manufacturing there are upstream supply chain sensitivities regarding the sourcing of key materials including rare earths (for magnets in wind turbines and electric vehicle motors), cobalt and lithium (for batteries) among others. Resolving that challenge is as much a matter of mining regulations, a toleration for pollution and a willingness to invest significant sums in research and development as much as direct state investment in new mines.

Source: Panjiva
We’re going to need a cleaner boat – reducing logistics networks’ emissions
Unlike power generation and personal transportation, the decarbonization of the logistics industry is at a much earlier stage. The good news is that there are no shortages of technological solutions. The bad news is that the nature of the assets make for complex regulation and a reduced self-interest for national governments.
Some progress is being made. The European Union is moving to include shipping in the emissions trading scheme in 2021, as it has already done for aviation. The International Maritime Organization is moving towards mandating reduced emissions levels, which proved effective in desulfurization.
Broadly speaking there are two strategies that can be followed: switch to a non-carbon emitting fuel source at point of use or; electrify the motive force for the mode of transportation and produce power with carbon-free resources. For the shipping industry the former is more applicable for long-haul routes while the latter is more suitable for trucking and local waterborne transportation. Airfreight remains something of a challenge given the energy content-to-weight constraints.
The shipping industry, and particularly the container-lines, have several technology options available for alternative fuelling including: liquefied natural gas as a reduced emissions option; ammonia / other green combustion fuels; carbon-capture systems; hybrid electric; and the original sailing technology of wind, modernized in systems such as Yara Marine’s wind-assist system and Neoline’s ferry system.
The container lines are also in the midst of a new round of investment after a period of reduced spending on new vessels and at a stage when elevated shipping rates have driven increased profitability for the container lines.
One challenge though is picking the “right” technology given vessels ordered today will only be delivered in two to three years time and will need to last for 20 years or more. Alphaliner data shows that there are already 3.09 million TEUs of new vessels on order by the top 25 shipping lines, equivalent to 13.7% of volumes owned and chartered by those firms.
The elevated level of shipping rates will likely be baked into annual contracts, providing a degree of financial surety for the shipping firms. Both shipping rates and carbon emission permits (EU ETS) have expanded rapidly in 2021.
S&P Global Platts assessment for global container shipping rates rose by 90.1% in Q1’21 on average versus Q4’20 while EU carbon permits rose by 28.6% according to S&P CapitalIQ data. Both also hit lifetime highs during the quarter with container rates peaking at $4,570 per FEU in March while emissions permits reached 42.9 euros per ton in mid-March.

Source: Panjiva
The starting point, however, is for cargo owners and shipping companies to have better visibility on the emissions choices that are embedded in their supply chains. That’s led freight forwarders including C.H. Robinson and Flexport to provide carbon emission calculators and for an increasing range of emissions offset products such as that offered by DP-DHL.
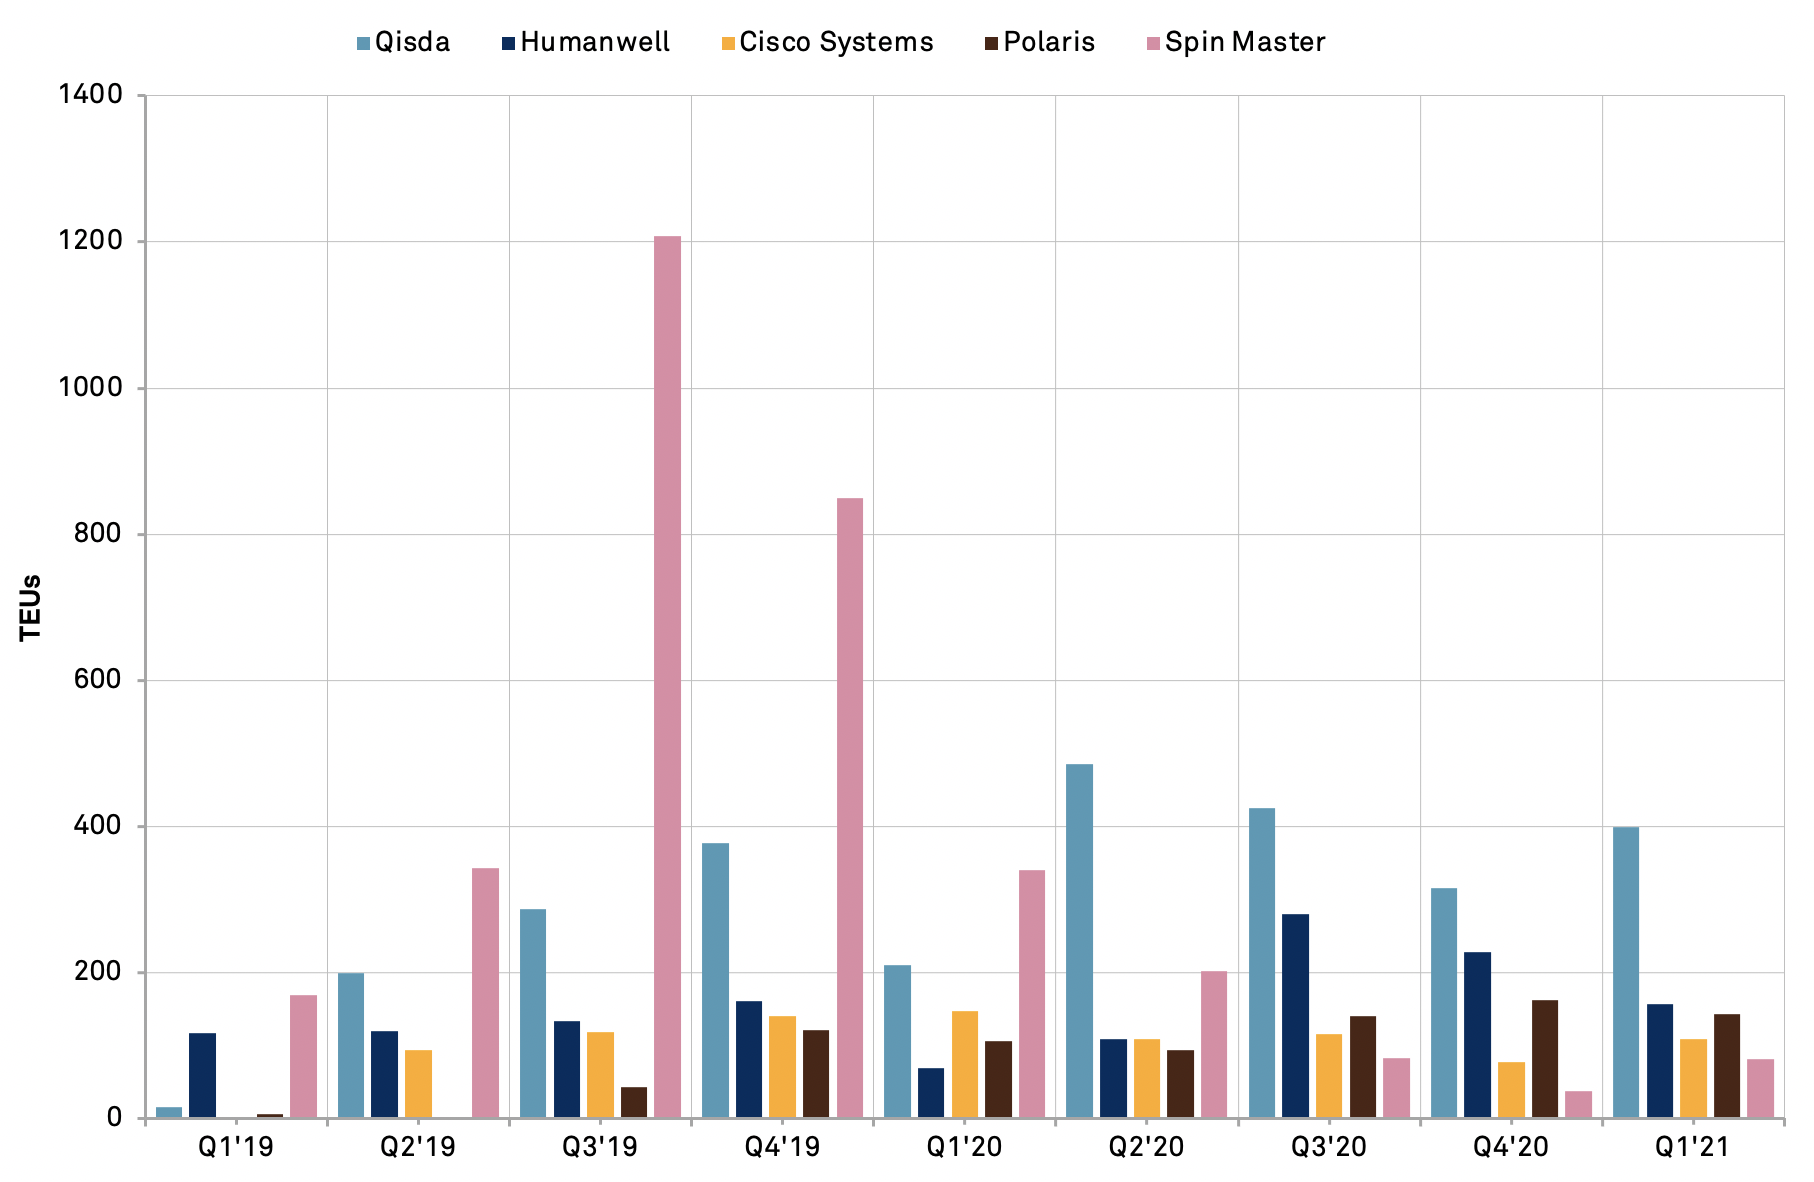
The level of potential emissions normally increases with the length of the supply chain, putting mitigation measures aside. That makes longer-distance routes such as east and southeast Asia to the U.S. northeast coast particularly challenging.
Panjiva’s data shows that some of the largest shippers on such routes that use Flexport, C.H. Robinson or DP-DHL services include shipments linked to: Qisda with 1,630 TEUs handled predominantly by DP-DHL in the 12 months to March 31; Humanwell with 777 TEUs handled by C.H. Robinson; and Cisco Systems with 410 TEUs handled by Flexport.
Source: Panjiva
Plugging the leaks key to carbon pricing mechanisms
A central concern of the Paris Agreement and Kyoto Protocol has been “common but differentiated responsibility and respective capabilities“. While allowing for an easier path to the widest range of commitments, it has led to concerns regarding “carbon leakage” where one country’s rules or incentives are less stringent / more generous than another’s. In turn that has led many countries to consider augmenting their carbon emission permitting or tax schemes with carbon border taxes.
The European Union is the closest to such a scheme, the Financial Times reports, while the Biden administration may augment any future internal carbon border tax or cap-and-trade scheme with an import levy designed to impose similar rules on imports from the rest of the world.
Panjiva’s analysis of World Bank data shows that as of Nov. 2020 there were carbon pricing or tax schemes across 32 countries on top of the EU ETS in place or scheduled globally. The average implied carbon price was with an implied carbon price of $28 per ton of CO2 equivalent on average in a range of $0.07 (Poland’s carbon tax) to $133 (Sweden’s carbon tax).
There are also a slew of sub-national schemes that could be scaled to national schemes to avoid carbon border taxation including China’s pilot regional trading schemes and U.S. trade schemes in California and Massachusetts.
Industries with significant scope 1 emissions may be those targeted soonest, with the steel, aluminum and pulp / paper sectors all being significant emitters globally according to the UN’s Intergovernmental Panel on Climate Change.
Panjiva’s data shows that U.S. imports of steel and aluminum from countries without a carbon pricing or tax scheme underway only accounted for 22.7% of the total in the 12 months to Feb. 28, with the largest supplier countries falling under that umbrella being Taiwan and Brazil with 4.7% and 3.4% respectively, followed by India and Russia with 2.4% and 1.8% respectively.

Source: Panjiva
Leading U.S. importers of steel and aluminum from the markets that don’t have carbon trading or taxation schemes may therefore face higher costs in the future. Panjiva’s data shows that leading importers that meet those criteria include aluminum makers Aluminum Bahrain and Emirates Global whose shipments increased by 6.4% and 33.4% year over year in Q1’21 respectively while shipments linked to Thyssenkrupp by 286%, admittedly from pandemic-depressed lows.

Source: Panjiva


