Es
Es1. Trump Makes Trade Grate
The U.S. elections on November 8 surprisingly returned President-elect Trump to form a new administration. As discussed in Panjiva research of November 9, trade has already become a central component for the new administration’s policies.
Wilbur Ross’s nomination as Commerce Secretary, the formation of a new National Trade Council under Peter Navarro and the appointment of Jason Greenblatt as Special Representative for International Negotiations all suggest a hawkish stance will be taken. In the 12 months to November 30 U.S. exports fell 3.8% on the same period 12 months earlier, while imports fell 2.4% according to official figures. Ross appears focussed on raising the former, while Navarro wants to cut the latter.

Source: Panjiva
2. Brexit Blows Exports Up
The U.K. electorate decided to leave the European Union as the result of a referendum on June 23. While the government has yet to trigger ‘Article 50’ of the European Union Treaties to start the negotiations, the pound already responded. A 22% weakening on a year earlier in October led to exports climbing 16.5% to their highest on record. Yet, British managers have already begun to become less optimistic about the future according to the latest CBI survey.

Source: Panjiva
3. T-Deals Dead, CETA Succeeds (Sort Of)
The Trans-Pacific Partnership trade deal with 11 other countries was a key part of President Obama’s “Asia-pivot”. While it was signed in February, it never made it to the U.S. houses of Congress, and President-elect Trump is firmly set against it in its current form. A similar deal with Europe, the Transatlantic Trade and Investment Partnership, also hit the skids with EU Commissioner Cecilia Malstrom describing the deal as probably being “in the freezer”.
More positively the EU and Canada agreed the Comprehensive Economics and Trade Agreement (CETA) in October, but only after intra-Europe negotiations resulted in it becoming contingent on European Court of Justice Approval. The European Union’s exports to the U.S. have slowed, with growth reaching just 0.1% in the 12 months to October 31, Panjiva data shows, while exports to Canada fell 3.2% based on Statistics Canada information.

Source: Panjiva
4. China Cooks Up Asian Alphabet Soup
China spent much of 2016 building up its own regional trade deals. Central to this has been the Regional Comprehensive Economic Partnership (RCEP) across Asia as a counterweight to TPP. While there are still a lot of details needed to complete the deal, significant progress was made during the year on both RCEP and a similar deal for central Asia (the Shanghai Cooperation Organization).
Longer term this may form part of a broader Free Trade Area of Asia Pacific ( FTAAP). China’s total trade globally ( exports plus imports) has fallen 4.4% in the three months to October 31 in dollars and by 10.3% in the past 12 months vs. 2013 according to Panjiva data.

Source: Panjiva
5. Steel Wars, Aluminum Awakens
The opening of the Global Forum on Steel Overcapacity was initiated in September with a view to reducing production of the metal and its derivatives. This hasn’t prevented a plethora of steel-related trade cases being carried out, and not just against China.
In the fourth quarter alone the U.S. completed, or has running, cases on rebar, carbon-steel flanges, pressure-pipes, cut-to-length plate, and carbon-grade pipes while the EU is investigating, or has completed cases on, large-scale seamless pipes, corrosion-resistant steel, heavy plate and hot-rolled steel. Even New Zealand has joined the party with an investigation into galvanized steel imports from China.
In the meantime, China’s exports of steel- and related products globally fell 9.2% in the three months to October 31 on a year earlier, Panjiva data shows. The only country to which exports increased significantly was Vietnam, with a 9.2% increase causing suspicions of diversions to avoid U.S. tariffs. The next battleground may be aluminum, where the U.S. industry launched complaints at the end of September, and the EU identified it as an area of concern as part of new trade rules in December.

Source: Panjiva
6. World Trade Wobbles
The global volume of exports scored two down months on a year earlier in 2016, in January and in October, Panjiva calculations based on CPB World Monitor data show. These were the first year-over-year declines since 2009. This meant that the average over the past 12 months vs. a year earlier showed an increase of just 0.9%, with Latin America being a notable leader until recently. The OECD remains confident that 2016 will see an overall increase of 2.0% for the year overall, which seems optimistic at this stage.

Source: Panjiva
7. Rates Drop and Pop, Revenues Rally
Overcapacity in the shipping industry led rates to drop during the year before recovering significantly later on. Rates for container shipping out of China dropped 13.0% from January 1st to their lowest on April 29, before recovering 27.6% to end the year 11.6% above where they started. From a longer term perspective the monthly trailing average rate increased on a year earlier for the first time in two years in mid-November. This had the result that container-liners’ revenues fell for seven straight quarters sequentially through the first quarter of 2016, but recovered 2.2% and 0.9% sequentially in the second and third quarters respectively.

Source: Panjiva
8. Hanjin Shipping Shot
The overcapacity that drove lower rates also claimed a victim in Hanjin Shipping. The South Korean shipper entered financial administration on August 31. Subsequently its assets have been steadily divested, with buyers of shipping assets including Maersk and Korea Line while port asset acquirers including MSC. A final decision on the group’s future was delayed until February 2017.

Source: Panjiva
9. Deals, Deals, Deals
Aside from the scramble to acquire assets from Hanjin Shipping out of administration there were several major deals announced or completed. These included CMA-CGM’s purchase of Neptune Orient, Hapag-Lloyd’s acquisition of UASC, Maersk’s announced intention to purchase Hamburg Sud and the proposed three-way merger of Japanese shippers Mitsui-OSK, K-Line and NYK. The Herfindahl-Hirschman Index of the U.S.-bound seaborne traffic in the three months to November 31, assuming the deals all completed, would be 371 vs. 289 without them, still well within the U.S. Department of Justice’s definition of a competitive market. This is the result of there being nearly 1,700 shippers active in the U.S., Panjiva data shows.

Source: Panjiva
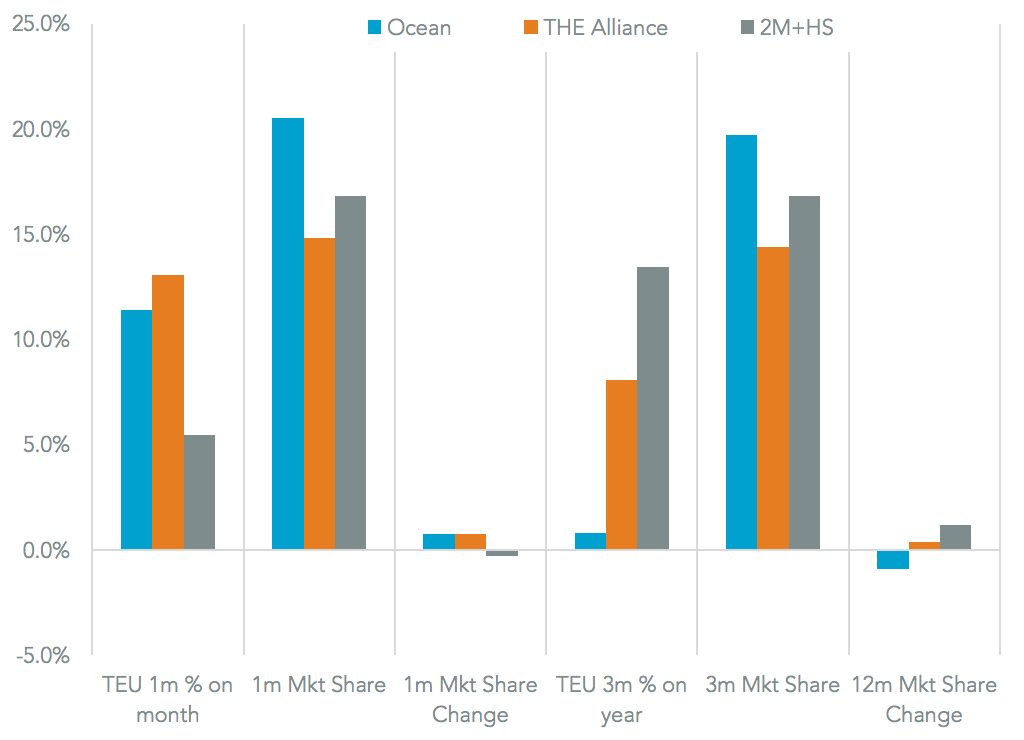
10. All Alliances, Few Rebels
As well as outright combinations of assets, two major alliances emerged during the year and one got (slightly) bigger. THE Alliance, announced in May and approved by the Federal Maritime Commission despite DoJ concerns, is led by Hapag-Lloyd, the three main Japanese shippers and Yang Ming. The Ocean Alliance, centered on COSCO Shipping and CMA-CGM, got approval from the FMC on October 24 to start operations in April 2017. Meanwhile the 2M alliance of Maersk and MSC carried out a slot-exchange and purchase deal with Hyundai MM in mid-December. The few shippers that do not have alliance membership looked to do side-deals with them, as Zim did with THE.
Source: Panjiva